NH ProfA guided tour
NH Prof has reached the level in which I can actually talk about the features that it has in more than abstract terms. There is still a big feature area that I want to cover (which should be a nice surprise), but the basics are there, and today I had ample proof that it is maturing just nicely. I was able to deal with quite a few of the remaining tasks by applying check listing. Basically, to do X, I had to do A,B & C. Trivially simple, and quite satisfying.
Test coverage went back up to over 90% on the backend again, which is also nice.
Anyway, let us start with the tour, shall we?
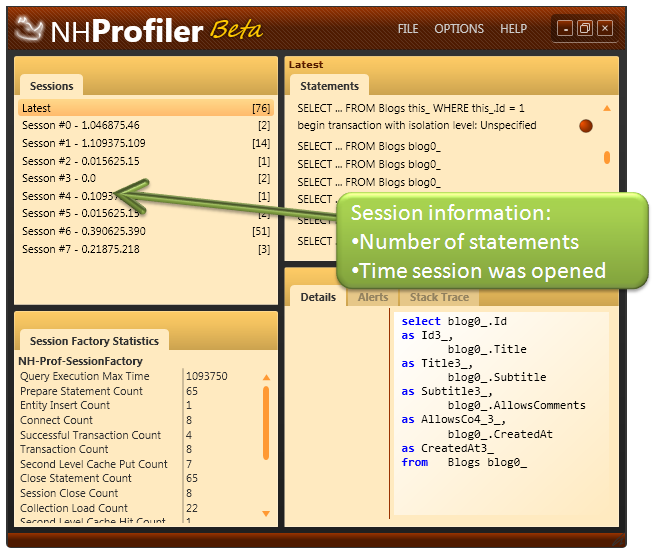
The left upper pane shows the captured sessions. You can see the number of statements per each session, as well as the length time it was open. Let us move down a bit, and explore statistics.
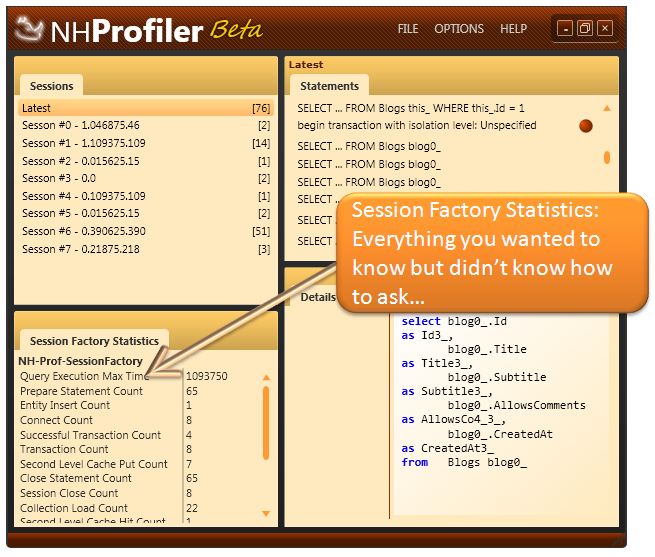
The session factory statistics pane include a lot of information about NHibernate, which can give you a good indication about what is going on in the application in a global fashion. In 2.0 we have quite a few data points, but the statistics feature was significantly expanded in 2.1, and contains a lot more data and more finely grained statistics.
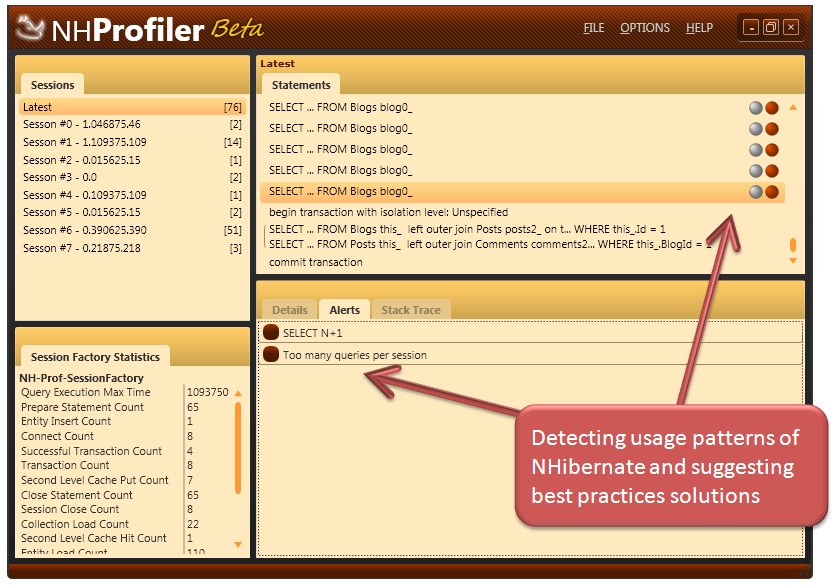
But that is probably not what gets you excited. What is likely to thrill you are the statement view.
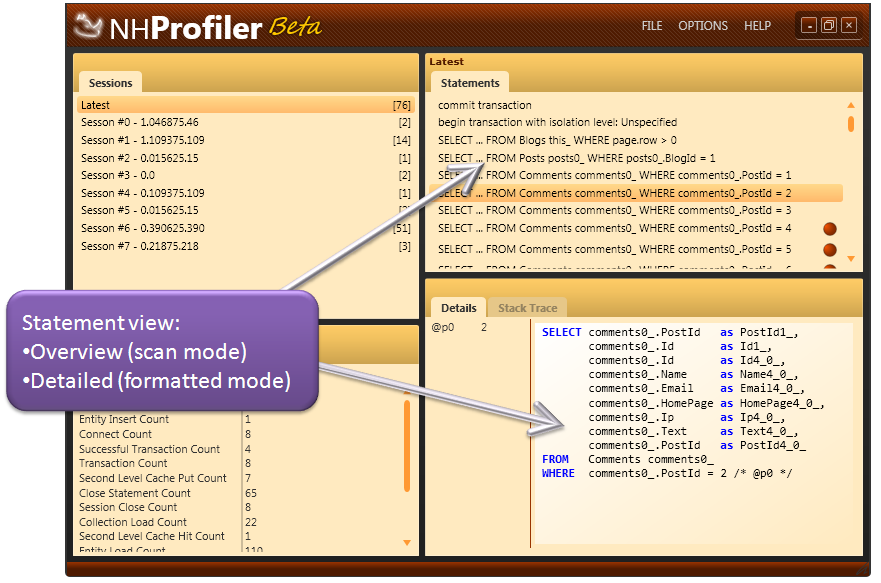
I put a lot of though into designing those (well, into thinking about them, the actual design was handled by people who actually know what they are doing, design wise). The upper section of the screen is optimized to allow the human eye to quickly scan it in order to find all sorts of interesting patterns. Compare this to SQL Profiler UI, and you can see why I think that this is a much better version, just from that stand point.
The bottom half, however, is what I really like. This is the part I use the most often, in order to really see what is going on. I did an ad-hoc demo of the profiler in Dallas, and one of the things that cam out of this was the format that you see on the lower pane. This UI is set to allow you to just copy the query from the profiler and immediately execute a readable, easy to understand query on Management Studio or Toad. Again, another piece where I think that I providing a lot more value than SQL Profiler does.
For quick reference, we put the parameter values on the left of the query, so you can inspect them without having to go into a potentially complex queries to try to figure out what is what.
But this isn't where it ends, let us take a look at the stack trace tab:
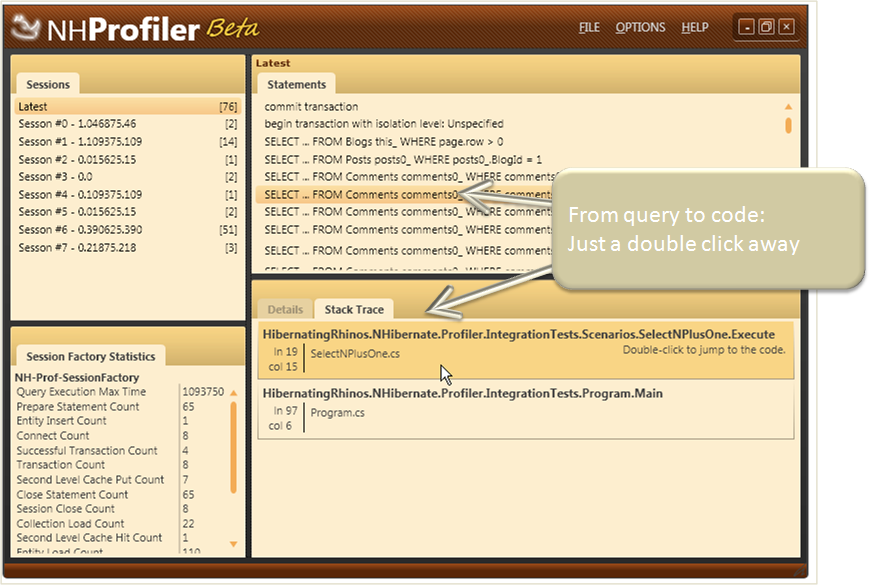
The stack trace will let you correlate a query and the code that generated it, and not only that, it will take you directly from the query to the code (opening visual studio, loading the file and landing you directly in the place in the code that caused this query to be executed.
Oh, and one more thing...
I have over four years of experience working with NHibernate, a time during which I learned quite a bit about what work, what doesn't and what kind of things we should be aware off. The profiler has given me the chance to codify a lot of these patterns, and put them in a way that allow you to have apply early detection and prevention mechanisms.
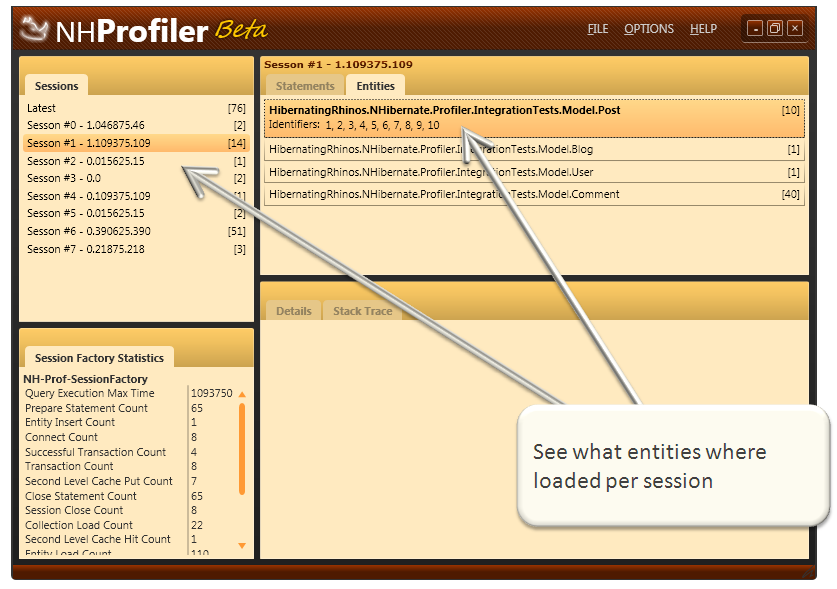
And one last thing, this time it will really be the last. Session / Entity inspection:
You can see exactly what are the entities that were loaded by this session, including counts per entity and all the ids that were loaded.
I hope to be able to open it for beta testing in two to three weeks, and a 1.0 release about a month after that. Pricing is tentatively set at 200$ per user, but this is subject to change.
More posts in "NH Prof" series:
- (09 Dec 2010) Alert on bad ‘like’ query
- (10 Dec 2009) Filter static files
- (16 Nov 2009) Exporting Reports
- (08 Oct 2009) NHibernate Search Integration
- (19 Aug 2009) Multiple Session Factory Support
- (07 Aug 2009) Diffing Sessions
- (06 Aug 2009) Capturing DDL
- (05 Aug 2009) Detect Cross Thread Session Usage
- (22 May 2009) Detecting 2nd cache collection loads
- (15 May 2009) Error Detection
- (12 May 2009) Queries by Url
- (04 Feb 2009) View Query Results
- (18 Jan 2009) Superfluous <many-to-one> update
- (18 Jan 2009) URL tracking
- (10 Jan 2009) Detecting distributed transactions (System.Transactions)
- (06 Jan 2009) The Query Cache
- (05 Jan 2009) Query Duration
- (24 Dec 2008) Unbounded result sets
- (24 Dec 2008) Row Counts


Comments
Awesome! I love it! One question and one suggestion:
q: In addition to showing the "latest queries", does it show the worst-performing queries? I would especially like an elapsed-time and a time-per-row ranking available
s: In the generated Detail format mode, emit parameter DECLARE and SET statements that match the values and types used in the mapping. This will catch-out stupid things like VARCHAR(x) colums / NVARCHAR(y) parameter oopsies when pasting into SQL Analyser since the query plan with correctly reflect what happened. Otherwise your use of literals pasted in will incorrectly let SQL server defaulting to "help" or "mask" such issues.
I'll just say, good luck with the tool.
Will you be posting a little bit about architecting it and design/code decisions you've made. I like this kind of your posts :) They are a great source of knowledge from the front
Damn, I want this now! Oren, work faster :)
Seriously, this is awesome, I'm sure that I've got all kinds of bloated querys and such hiding in my application, but finding them is almost not possible. This tool will help me do just that.
How on earth can you be this productive whilst working as a full-time contractor? I'm lucky if I can get in 2 hours a day of programming after work. :-)
Do you not sleep?
I should probably clarify that, I've been keeping an eye on the NHProfiler from your blog posts and it seems you've only been working on it for a couple of weeks.
Great!
Wouldn't it also be possible to include mem usage per ISession? I mean the size of the snapshot. That would be a great additional and useful feature I think.
This does look awesome :) i like the idea of suggesting best practices, and the depth of information is brill.
Would there be any value in doing a web-based server-hosted version further down the line? So, you'd point your browser at dev/live server and have access to much of this functionality? I've been working on an SQL IDE that is web based (called Squilbo) and I could see this working in a similar way.
Looking good.
One thing I think would be awesome, but maybe a v2 feature is being able to query the statistics "ala nDepend". For example
SELECT query WHERE results > 1000
or
SELECT session WHERE queries > 20
or even better
SELECT query WHERE responsetime(query) > 1000
James,
Your legit question was already answered a long time ago:
kyle.baley.org/...railsWhileTheyreHibernating.aspx
Krzysztof,
Yes, I'll probably discuss this at some length :-)
Tobin,
A web version would be interesting, but I am not sure about the actual usage scenarios.
Sounds like a good topic to explore after v1.
Roger,
That information is actually not available from within the CLR.
At the moment, I am trying very hard to do only things which can be done inside the CLR, because the cost of development elsewhere is _high_.
James,
I am working on it for a two to three weeks. The secret is that I was able to shell out the UI work for a couple of developers who are really amazing in the UI, leaving me to focus on the actual back end.
The backend itself is structured following the zero friction mode, so I don't get much problem from using it.
driesie,
That would be cool, I agree.
Marc,
I don't actually have this type of information when I am capturing the queries. And since I want to remain DB independent, I am not likely to be able to get it.
If this will be an important feature, I'll add this, but for now, I am focusing on giving high level view, not necessarily all the details
Why not NH Contrib?
Sergey,
This is not an OSS project, it is a commercial one.
Oren,
That was actually the question. Why not OSS? NH would benefit from having a tool like this.
Or maybe, you plan to support other ORMappers as well?
Sergey,
I am investing a LOT of time and money in it.
I would like to recoup my investment and actually get paid for doing the work
@Ayende
That is exactly the kind of thigs I'd love to read about :).
OT. Have you considered writing a book on architecture after you're done with the current one? I'm serious.
Yes, I'll speak about this.
And books takes up _so much time_, that I don't think I'll commit for another one any time soon
You know what would be REALLY cool... an extra tab for the underlying database execution plan. Would also be nice if you could group by statement template, e.g. SELECT x,y FROM table WHERE z=? occured 7 times, fastest was 8ms, slowest was 1200ms.
Just if you miss it, you are misspelling Session in the left upper pane... Looks great though!
perhaps a split the license??
-a commercial one
-and a cheaper one for people only intending to use it only for OSS projects
Looks incredible. $200 is a bargain.
Ridicules! Why has everything to be free or very cheap? Open source is great, but look at how much he is already giving to the community, not just the tools/utilities but also all the sharing of knowledge. Stop whining, if you like the tool and want to use it just pay the small fee, it’s not like he is ripping you off.
-Mark
I believe you could sell it for more than 250$ and still find a good bunch of interested (and happy) customers and NHibernate users.
Congratulations for your work, it seems awesome!
At the risk of starting a flame war i will make one reply regarding the price / license.
First I believe Ayende was asking for feedback and I was making a suggestion. I did not say “$200 is too expensive”.
Secondly while we are on the topic "$200 is a bargain".
Well thats $200US correct? Well $200USD is relative to your locality. Taking into account exchange rates and average income for developers that can be a large amount of money for some countries. For example india or Malaysia. Now I am not pretending to have a solution to this but when pricing software that is targeted at a global audience you should consider what your global audience can afford.
Thirdly “cheaper for open source”.
Many open source projects like to make use of various tools, addins and other software. Whenever you choose a tool to help facilitate development of an OSS you create a barrier of entry. The reason is that, ideally, all contributors will have access to this tool. The larger the cost the higher the barrier or entry. For an example: I have seen some projects recently who state in their guidelines “No resharper warnings in code”. So if I don’t have resharper I cant contribute?
Finally I would pay $200 USD. Even though with the GEC and the drop in our dollar it will now cost me almost 30% more than it would have couple of months ago.
"The stack trace will let you correlate a query and the code that generated it"
Love it
Why should you consider a global audience - you only have to consider developers who would actually pay for the software in the first place.
If it was "world-priced" at $50 then he potentially earns much less money since the developers in emerging market countries are unlikely to buy it anyway and you now have to sell 4x the quantity to make up for the price drop.
Also it is very likely that your target audience (or at least a large part) are actually companies using NHibernate in their development projects. Now for these companies a 200$ price tag is a 'normal' license cost per developer.
So in my eyes 200$ is surely not to much.
My irritation goes to those (and it is not just here, you will see them everywhere) people that never want to pay for anything, even if they most likely can afford it ;) You cannot expect everybody to do everything for free, they have to earn a living too, just be happy with what you do get for free.
And I am sure that if indeed you cannot pay and you are truly using it for Open Source and you are contributing to the community, then you might be able to find a sponsor for it. Hey maybe even Oren would give you a break.
-Mark
Great tool, It is really awesome and it could really helps people to better understand how NH is performing for our application, I love the part where you detect problems and gives suggestions :D
Another Great Work from Ayende|
alk.
Looks fantastic, a definite must for using NHibernate.
Is the UI done with WPF ?
As mentioned above:
"The backend itself is structured following the zero friction mode"
Please share when you have time!
Will you include a license that includes the source ?
Steve,
Yes, the UI is WPF.
I'll have a couple of posts about that today.
As for source licensing, probably so, if people really want it.
Hey Ayende,
Looks like you have almost all your documentation complete! :)
Hope all is well in NJ
Regards,
J
Ayende... you are THE man !
Really cool project. Actually I'm working on compating NHibernate, Entity Framwework and some other ORM tools in my freetime. Too bad there aren't any tools for other ORM frameworks (at least none I know).
Is this tool meant to replace NHibernate Query Analyzer or to compliment it? I noticed that QA hasn't been updated to support NHib 2.0 GA. Is that planned?
Matt,
I am no longer maintaining NHQA. Mostly because I don't have any interest in doing so.
If you want to send a patch that would do that, I would be grateful
But will NH Prof have some of that functionality? Specifically around transposing SQL and HQL queries? That is a very useful function.
Matt,
Then functionality will be there, but not directly.
Where i can get link to download and try this soft?
You'll be able in a few weeks.
Any news about community available version of NH Prof? :)
Comment preview