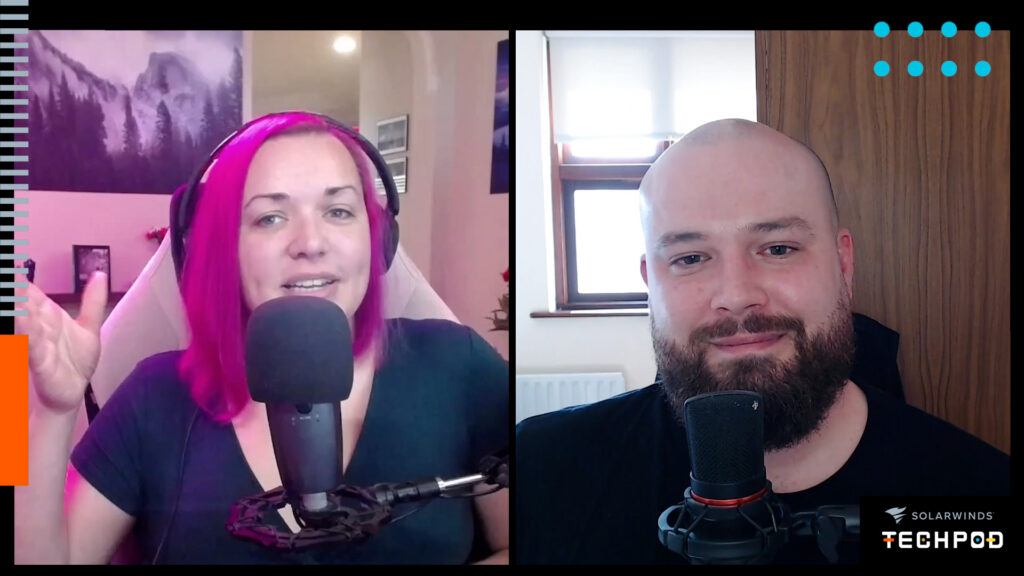
Inside the Conversation: What We’re Hearing at SolarWinds World Tour
June 1, 2026
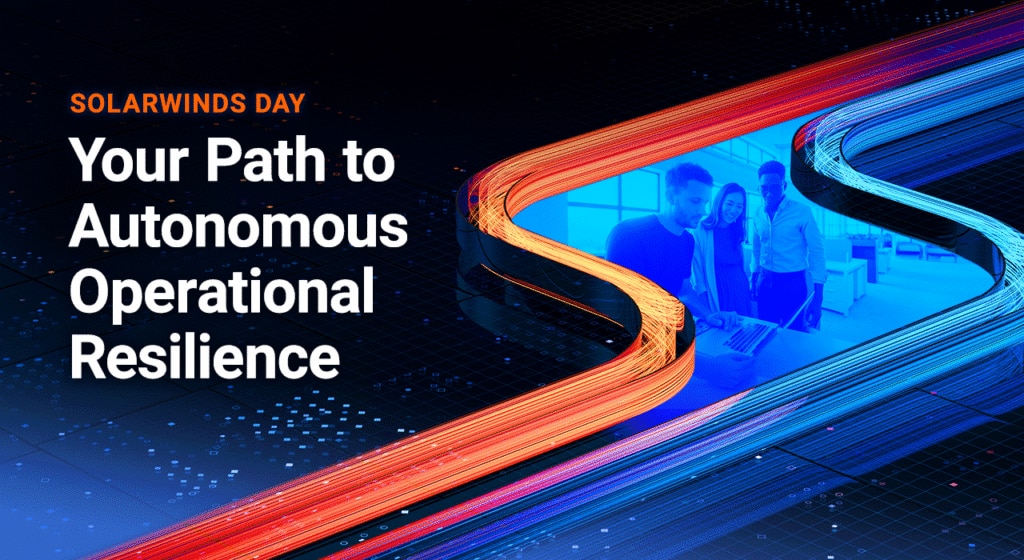
Navigate complexity with confidence. Meet the SolarWinds® AI Agent, your new context-aware digital teammate designed to cut through complexity, surface what actually matters, and help you move from reactive troubleshooting to confident, proactive operations.
The 2026 SolarWinds World Tour is hitting the road, and you’re invited! This global, in-person event series brings together IT professionals, customers, and partners for a high-energy day of live demos, technical deep dives, and future-focused discussions on AI, observability, and the path to autonomous operational resilience. Seats are limited to keep the conversations meaningful, so don’t wait. Find the event near you and register today.