*Based on the list of 2025 Fortune 500® companies with recurring revenue to Qlik during the 12-month period ending June, 2025. Fortune 500 is a registered trademark of Fortune Media IP Limited. Qlik is not affiliated with or endorsed by Fortune.
Modern data integration, AI, and analytics
Get The AI You Were Promised
Make your data work for AI with trust, context, and the freedom to adapt to what comes next.
Seamless data integration and powerful Agentic Al analytics to drive better business decisions
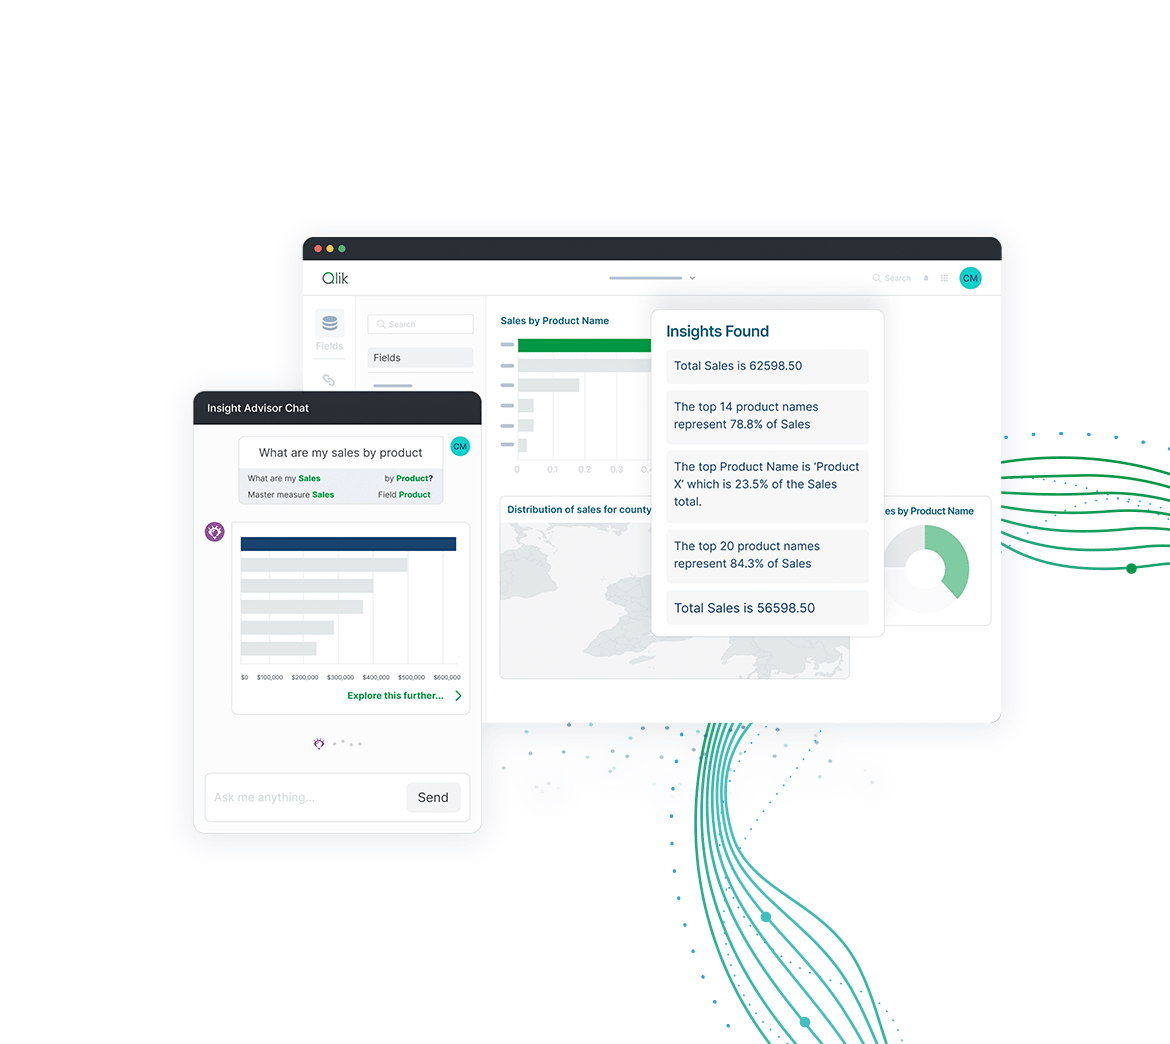
NEW - QLIK AGENTIC AI EXPERIENCE
AI that does the work.
Qlik’s Agentic AI framework makes the world’s most powerful data integration and AI-powered analytics platforms into the most simple to use insight-into-action tool.
Faster Time to Value
Easier Adoption
Swift Insight to Action
75% of the Fortune 500® use Qlik*
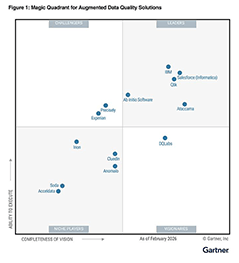
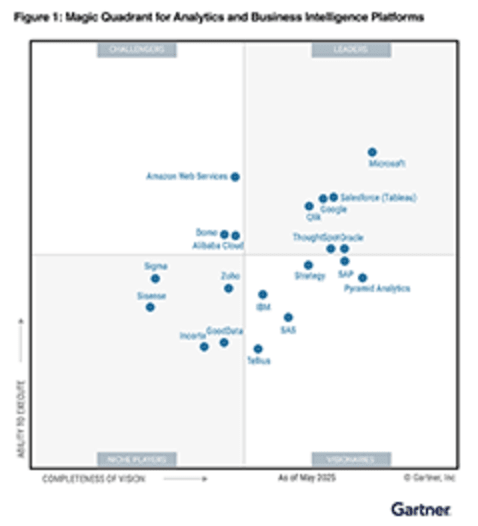
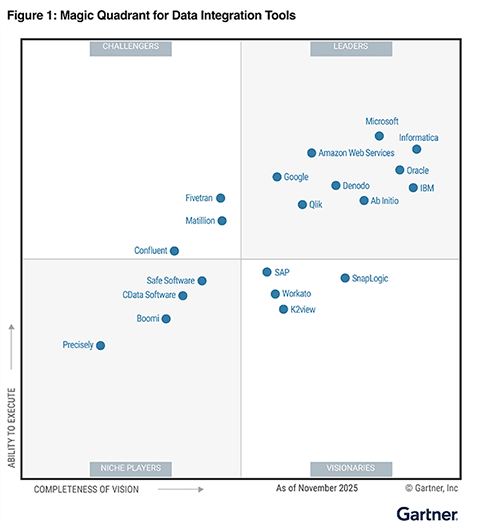
Team up with a Gartner® Magic Quadrant™ leader
in three categories


Get the AI you were promised.
Join us and learn how to turn your data into fuel for agentic AI at scale.

Customers making data work for AI