Toluna – an innovation leader. As seen on USA Today.
Discover why Toluna was selected to be the Innovation Leader in the insights industry in USA Today’s new short documentary series,
Toluna Synthetic Personas – now available globally – are groundbreaking survey-takers available within the Toluna Start platform, delivering decision-ready intelligence at the speed and scale of AI.

A realistic life history
Deep layers of attitudes and motivations
Rich demographic and psychographic attributes
Lifestyle and consumption habits
Ability to ‘see’, ‘hear’ and react to dynamic stimulus
Demonstrate emotional and rational instincts plus intelligent reasoning
Based on anonymized data from Toluna’s global panel of 79M people, our synthetic personas empower brands to test ideas, attributes, claims, messages and more at speed and scale without compromising on quality.

Our market research solutions deliver insights that fuel growth, helping brands stay ahead in an ever-evolving world. With flexible solutions ranging from DIY research to expert-led consultancy, we adapt to your unique challenges, enabling faster, smarter decisions that propel your business forward.

Understand how your brand is perceived and discover how to improve the value and efficiency of your communications.

Elevate your brand by evaluating categories, testing product ideas, developing impactful packaging, and through deep consumer and shopper journey insights.

Craft research studies to suit your unique needs with our industry-leading market research platform, Toluna Start.
Toluna is built differently. We blend scale, innovation, our end-to-end solutions, and deep expertise to deliver the insights, clarity, and momentum you need to thrive in a fast-changing world.

Innovative technology and end-to-end research platform that bring unparalleled flexibility, speed, and depth to your insights.

Flexible solutions built to tackle today’s complex challenges across all phases of the insights journey and service models – from DIY to full service.

Connect with the right audiences via our global panel of 79+ million members, offering unmatched scale and reach.

Dynamic expert servicing, tailored to your needs and supported by our dedicated team at every step.

At the heart of our solutions portfolio is our AI Everywhere strategy, which seamlessly blends human intelligence and expertise with artificial intelligence (AI) to create what we call augmented intelligence. This powerful synergy sets our solutions, platform ecosystem, and data apart. Whether you want to conduct DIY research on our platform or leverage our full-service competencies, we empower your brand to uncover deeper insights, make better-informed decisions, and achieve unprecedented growth.
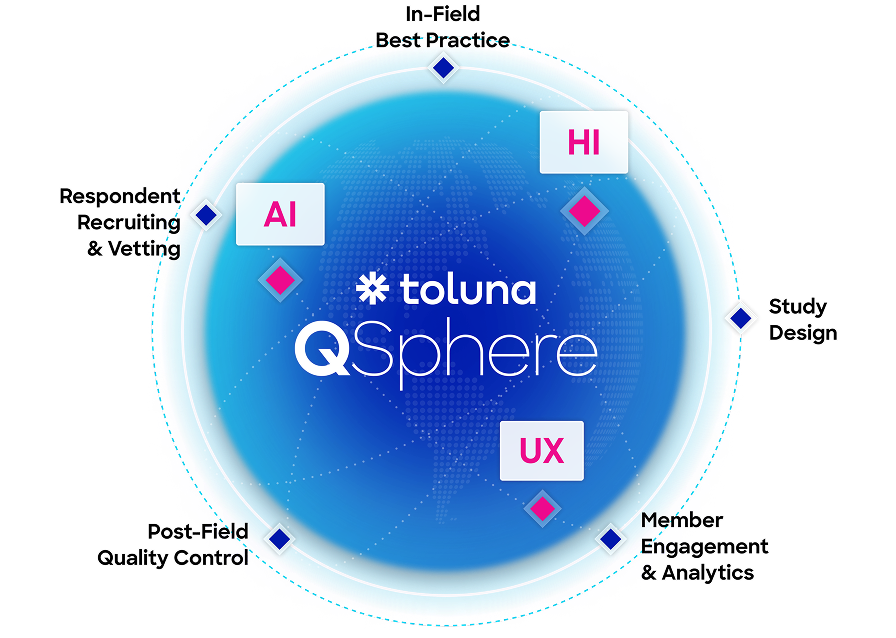
Data quality is the foundation for smarter decisions. Toluna QSphere, our industry-leading quality approach combines advanced AI, human expertise, and UX-driven principles to redefine what high-quality data means. With Toluna QSphere, you gain the confidence to act decisively, knowing your insights are built on accurate and reliable data.


“We worked with Toluna’s legacy brand MetrixLab on our brand equity tracking and in-market campaign evaluations, across our categories and brands in Europe. Their solutions in both areas fit perfectly with our needs and always provide very tangible and actionable insights that we can immediately put to work. While MetrixLab – Toluna comes with tools, what I appreciate is that they are market researchers at heart: they will always adjust and customize depending on the brief, which is very much needed given that one size does not fit all.”
Vito Petrosino
Senior Director Confectionary Europe, Strategy, Insights & Analytics
Mondelez
“Toluna Start is probably the best investment we’ve made recently. It’s helped us gather consumer insights super quickly, test concepts on the fly, and uncover those hidden gems that make all the difference. The platform is easy to set up, turnaround is fast, and when you need to do something a bit more complicated, their support team is responsive and helpful – and a pleasure to work with. It’s transformed how we work; turning “we should look into that” into actionable insights before the coffee gets cold. I’d recommend it to anyone in a heartbeat, even though part of me wants to keep it a secret.”
Jerome Linder
Head of Consumer & Market Insights, APAC
Ofi
Hear from our expert researchers & thought leaders and stay updated with the latest insights, trends, and news from across the globe.