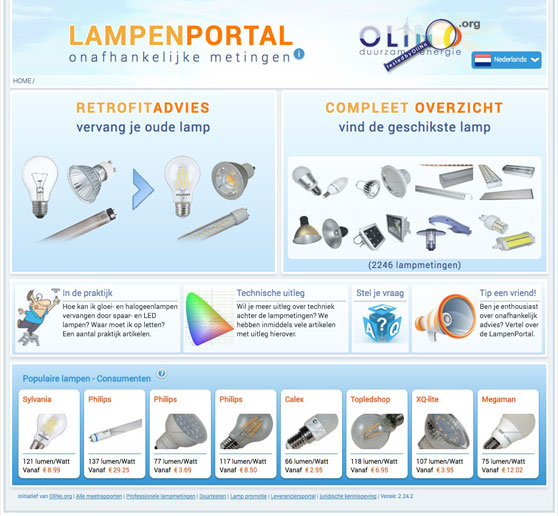
Professionele Lampmetingen

Goniometrische metingen
Snel: doorlooptijd 1 week
Voordelig: vanaf €175,-
Snel: doorlooptijd 1 week
Voordelig: vanaf €175,-


Lezingen door onafhankelijke experts


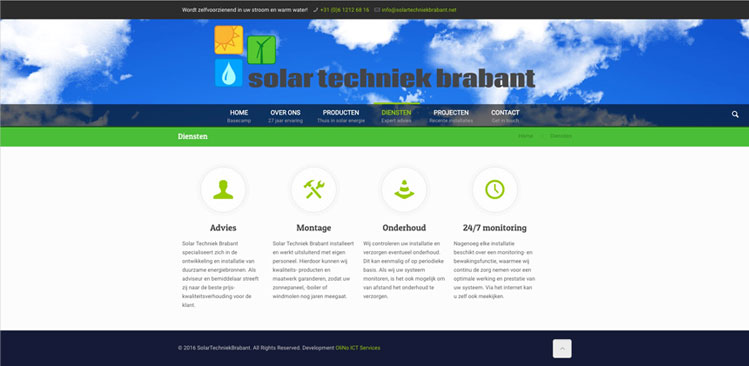
Professioneel Webdesign
Nieuwe professionele website
WordPress
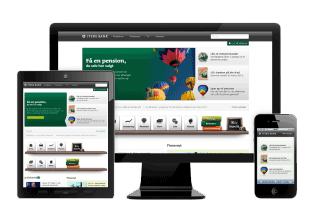
Werkt op desktop, tablet en mobiel
Voordelig: vanaf €495
WordPress
Werkt op desktop, tablet en mobiel
Voordelig: vanaf €495