Business Intelligence Consulting that fuels smart results so fast you’ll freak.
P3 Adaptive turns chaos into decisive action. Two weeks to actionable solutions. Guaranteed.
The Robin Hood of data.
We make big data capabilities accessible for the business leaders who need insight most.
That thing that keeps you up at night. That competitor who always sees an opportunity before you do. That logistics issue that has reached critical mass. Your most dreaded problems are our favorite problems to solve.


Punch above your weight.
Start taking advantage of big company talent, technology, and resources.
REAL RESULTS
Action-ready insights, confident decisions
You don’t want a dashboard. You want clarity, executive-level insights you can actually use to make improvements, and the confidence to make them fast. That’s what we do, and that’s what you’ll get when you work with P3.
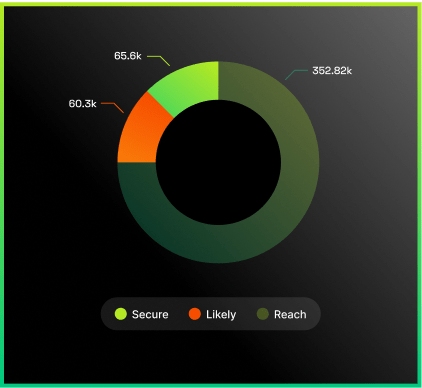
Projected Membership Forecast by Type
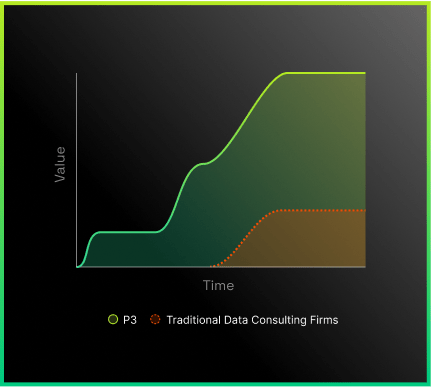
Time to Value
ANTI- STATUS QUO
Get what you need in weeks, not months
Speed is part of our competitive edge, and we’ll make it yours too. Our team takes full advantage of cutting-edge technologies, and our expert consultants craft custom solutions for every project. We deliver results at a pace and price that works specifically for you.
“While at Microsoft, I realized that emerging data tools enabled a leaner, more agile consulting model with better ROI, especially for the midmarket. Seeing no movement from Microsoft’s partners, I started P3 to lead the change.”
Rob Collie, CEO @ P3 Adaptive
OUR APPROACH
The data partner you’ve always wanted
You’ve probably had a less-than-stellar experience with another data firm… we have too. That’s why we work directly with business leaders and owners, and operate without any blindfolds, surprises, or things unsaid. You’ll know every detail, have all your questions answered, and get to see the work advance in real-time.

Director of Process Improvement, Kaman Industrial Technologies
“Lifechanging. It’s made me a better analyst, and I recommend this courses to folks all over my organization. We’re able to build complex models in a matter of weeks, and use a few great DAX patterns to fix reporting issues that otherwise would have taken months or years to develop!”
Executive VP of Finance, Systems & Culture, Dairyland Electrical Industries
“Partnering with P3 was one of those clarifying moments about what great partnerships could be. We found people with fantastic expertise who were a pleasure to work with and delivered really good work. It sounds basic, but that combination is actually challenging to find, and we really appreciate the partnership.”
How we do it
Implementation
Fingers hit keyboards, and you’ll see your data transformed into valuable insights.
Training
Fundamentals to expertise, we’ll show you it all so you can eventually do it without us.

Industry: Oil and Gas; Department: Finance and Operations
Read Case StudyIndustry: Manufacturing; Department: Operations
Read Case StudyIndustry: Chemical Manufacturing; Department: Process Improvement
Read Case Study