
 It is the first Saturday of the month, so it is time for a goals/progress update. A month like June makes you appreciate being a dividend investor. While other investors are focusing on their market losses and negative total returns, I and other dividend investors are able to look at net positive metrics such as an increase in annual dividend income. That's not to imply that we escaped the losses (I didn't as I will discuss next Saturday), but the day-to-day gyrations of the market is not how we measure success. Instead, our goal is steadily build a stream of dividend income over the years. To that end, progress was made in June. Now onto the numbers.
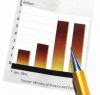
My goals were defined in this December 1, 2007 Investing Goals post. Below is an updated version of the table found in the original post.
| Description | Dividend Income Annualized | Yield on Cost |
|---|---|---|
| 2027 Goal | 110,000 | 20.00% |
| 2017 Goal | 30,000 | 10.00% |
| 2008 Goal | 4,000 | 4.90% |
| Dec/2007 | 3,054 | 5.00% |
| Purchases YTD | 1,747 | 0.22% |
| Div. Changes YTD | 50 | 0.07% |
| Sales YTD | (120) | 0.06% |
| June/2008 | 4,731 | 5.35% |
| Purchases | 133 | -0.08% |
| Div. Changes | -32 | -0.04% |
| Sales | 0 | 0.00% |
| May/2008 | 4,630 | 5.47% |
| Net Changes | 424 | 0.27% |
| April/2008 | 4,206 | 5.20% |
| Net Changes | 188 | -0.06% |
| March/2008 | 4,018 | 5.26% |
| Net Changes | 461 | 0.13% |
| February/2008 | 3,557 | 5.13% |
| Net Changes | 277 | 0.14% |
| January/2008 | 3,280 | 4.99% |
| Net Changes | 226 | -0.01% |
| December/2007 | 3,054 | 5.00% |
| Net Changes | 228 | 0.12% |
| November/2007 | 2,826 | 4.88% |
For the month, dividend income increased $101, and Yield on Cost (YOC) decreased -0.11%. These changes were driven by new purchases and dividend changes (no sales in June). Let's examine each of the these categories:
Purchases: The $133 increase in annual dividend income and -0.08% decrease in YOC related to the following purchases (yield at the time of purchase):
- $27 PEP (2.51%)
- $52 BP (4.57%)
- $54 VYM (3.40%)
Dividend Changes: The -$32 decrease in annual dividend income and -0.04% decrease in YOC related to the following dividend changes (a=dividend stated in annual terms, q=quarterly, m=monthly):
- $6 JNJ : 0.415q>0.46q : 0.00%
- $2 VYM : 1.65a>1.67a : 0.01%
- ($7) VFH : 1.67a>1.56a : (0.01%)
- ($34) VNQ : $4.05a>3.05a : (0.04%)
- $1 VIG : 0.98a>1.00a : 0.00%
The erratic ETF dividends continue to be problematic. I have opted to convert to a trailing 12-month convention for measurement. Some of the above decreases related to my conversion, while others are true year-over-year decreases in dividends. I am making some other changes in my ETFs which I will discuss in a later post.
Sales: I did not sell any income portfolio investments in June.The next monthly progress update will be on Saturday, August 2nd.
(Photo: sanja gjenero)
Related Articles:


That's all pretty complicated-looking to me. I don't do that kind of analysis on my own returns, I guess. I just pay attention to cashflow increase. I should probably learn how to do the Yield on cost etc., but for now concentrating on cashflow is good enough for me. I agree with what you said above; I like the low prices we see in June - time to buy stuff up (I'm also primarily a dividend investor, though I'm also interested in growth commodities).
MoneyEnergy: In the end, cashflows is all that really matters.With the markets at a low, this is a good time to pick up some deals.
Thanks for stopping by and commenting!
Best Wishes,
D4L