Full disclosure: Patrick at NDepend gave me the license for testing and showing off NDepend for free. I’m not compensated for the blog post in any way other than the license, but I figured it’d be fair to mention I was given the license.
I’ve loved NDepend from the start. I’ve been using it for years and it’s never been anything but awesome. I still think if you haven’t dived into that, you should just stop here and go do that because it’s worth it.
The main NDepend GUI is Windows-only, so this time around, since I’m focusing solely on Mac support (that’s what I have to work with!) I’m going to wire this thing up and see how it goes.
First thing I need to do is register my license using the cross-platform console app. You’ll see that in the net8.0
folder of the zip package you get when you download NDepend.
dotnet ./net8.0/NDepend.Console.MultiOS.dll --reglic XXXXXXXX
This gives me a message that tells me my computer is now registered to run NDepend console.
Running the command line now, I get a bunch of options.
pwsh> dotnet ./net8.0/NDepend.Console.MultiOS.dll
//
// NDepend v2023.2.3.9706
// https://www.NDepend.com
// support@NDepend.com
// Copyright (C) ZEN PROGRAM HLD 2004-2023
// All Rights Reserved
//
_______________________________________________________________________________
To analyze code and build reports NDepend.Console.MultiOS.dll accepts these arguments.
NDepend.Console.MultiOS.dll can also be used to create projects (see how below after
the list of arguments).
_____________________________________________________________________________
The path to the input .ndproj (or .xml) NDepend project file. MANDATORY
It must be specified as the first argument. If you need to specify a path
that contains a space character use double quotes ".. ..". The specified
path must be either an absolute path (with drive letter C:\ or
UNC \\Server\Share format on Windows or like /var/dir on Linux or OSX),
or a path relative to the current directory (obtained with
System.Environment.CurrentDirectory),
or a file name in the current directory.
Following arguments are OPTIONAL and can be provided in any order. Any file or
directory path specified in optionals arguments can be:
- Absolute : with drive letter C:\ or UNC \\Server\Share format on Windows
or like /var/dir on Linux or OSX.
- Relative : to the NDepend project file location.
- Prefixed with an environment variable with the syntax %ENVVAR%\Dir\
- Prefixed with a path variable with the syntax $(Variable)\Dir
_____________________________________________________________________________
/ViewReport to view the HTML report
_____________________________________________________________________________
/Silent to disable output on console
_____________________________________________________________________________
/HideConsole to hide the console window
_____________________________________________________________________________
/Concurrent to parallelize analysis execution
_____________________________________________________________________________
/LogTrendMetrics to force log trend metrics
_____________________________________________________________________________
/TrendStoreDir to override the trend store directory specified
in the NDepend project file
_____________________________________________________________________________
/PersistHistoricAnalysisResult to force persist historic analysis result
_____________________________________________________________________________
/DontPersistHistoricAnalysisResult to force not persist historic analysis
result
_____________________________________________________________________________
/ForceReturnZeroExitCode to force return a zero exit code even when
one or many quality gate(s) fail
_____________________________________________________________________________
/HistoricAnalysisResultsDir to override the historic analysis results
directory specified in the NDepend project file.
_____________________________________________________________________________
/OutDir dir to override the output directory specified
in the NDepend project file.
VisualNDepend.exe won't work on the machine where you used
NDepend.Console.MultiOS.dll with the option /OutDir because VisualNDepend.exe is
not aware of the output dir specified and will try to use the output dir
specified in your NDepend project file.
_____________________________________________________________________________
/AnalysisResultId id to assign an identifier to the analysis result
_____________________________________________________________________________
/GitHubPAT pat to provide a GitHub PAT (Personal Access Token).
Such PAT is used in case some artifacts (like a baseline analysis result) are
required during analysis and must be loaded from GitHub.
Such PAT overrides the PAT registered on the machine (if any).
_____________________________________________________________________________
/XslForReport xlsFilePath to provide your own Xsl file used to build report
_____________________________________________________________________________
/KeepXmlFilesUsedToBuildReport to keep xml files used to build report
_____________________________________________________________________________
/InDirs [/KeepProjectInDirs] dir1 [dir2 ...]
to override input directories specified in the
NDepend project file.
This option is used to customize the location(s) where assemblies to
analyze (application assemblies and third-party assemblies) can be found.
Only assemblies resolved in dirs are concerned, not assemblies resolved
from a Visual Studio solution.
The search in dirs is not recursive, it doesn't look into child dirs.
Directly after the option /InDirs, the option /KeepProjectInDirs can be
used to avoid ignoring directories specified in the NDepend
project file.
_____________________________________________________________________________
/CoverageFiles [/KeepProjectCoverageFiles] file1 [file2 ...]
to override input coverage files specified
in the NDepend project file.
Directly after the option /CoverageFiles, the option
/KeepProjectCoverageFiles can be used to avoid ignoring coverage files
specified in the NDepend project file.
_____________________________________________________________________________
/CoverageDir dir to override the directory that contains
coverage files specified in the project file.
_____________________________________________________________________________
/CoverageExclusionFile file to override the .runsettings file specified
in the project file. NDepend gathers coverage
exclusion data from such file.
_____________________________________________________________________________
/RuleFiles [/KeepProjectRuleFiles] file1 [file2 ...]
to override input rule files specified
in the NDepend project file.
Directly after the option /RuleFiles, the option
/KeepProjectRuleFiles can be used to avoid ignoring rule files
specified in the NDepend project file.
_____________________________________________________________________________
/PathVariables Name1 Value1 [Name2 Value2 ...]
to override the values of one or several
NDepend project path variables, or
create new path variables.
_____________________________________________________________________________
/AnalysisResultToCompareWith to provide a previous analysis result to
compare with.
Analysis results are stored in files with file name prefix
{NDependAnalysisResult_} and with extension {.ndar}.
These files can be found under the NDepend project output directory.
The preferred option to provide a previous analysis result to
compare with during an analysis is to use:
NDepend > Project Properties > Analysis > Baseline for Comparison
You can use the option /AnalysisResultToCompareWith in special
scenarios where using Project Properties doesn't work.
_____________________________________________________________________________
/Help or /h to display the current help on console
_____________________________________________________________________________
Code queries execution time-out value used through NDepend.Console.MultiOS.dll
execution.
If you need to adjust this time-out value, just run VisualNDepend.exe once
on the machine running NDepend.Console.exe and choose a time-out value in:
VisualNDepend > Tools > Options > Code Query > Query Execution Time-Out
This value is persisted in the file VisualNDependOptions.xml that can be
found in the directory:
VisualNDepend > Tools > Options > Export / Import / Reset Options >
Open the folder containing the Options File
_______________________________________________________________________________
NDepend.Console.MultiOS.dll can be used to create an NDepend project file.
This is useful to create NDepend project(s) on-the-fly from a script.
To do so the first argument must be /CreateProject or /cp (case-insensitive)
The second argument must be the project file path to create. The file name must
have the extension .ndproj. If you need to specify a path that contains a space
character use double quotes "...". The specified path must be either an
absolute path (with drive letter C:\ or UNC \\Server\Share format on Windows
or like /var/dir on Linux or OSX), or a path relative to the current directory
(obtained with System.Environment.CurrentDirectory),
or a file name in the current directory.
Then at least one or several sources of code to analyze must be precised.
A source of code to analyze can be:
- A path to a Visual Studio solution file.
The solution file extension must be .sln.
The vertical line character '|' can follow the path to declare a filter on
project names. If no filter is precised the default filter "-test"
is defined. If you need to specify a path or a filter that contains a space
character use double quotes "...".
Example: "..\My File\MySolution.sln|filterIn -filterOut".
- A path to a Visual Studio project file. The project file extension must
be within: .csproj .vbproj .proj
- A path to a compiled assembly file. The compiled assembly file extension must
be within: .dll .exe .winmd
Notice that source of code paths can be absolute or relative to the project file
location. If you need to specify a path or a filter that contains a space
character use double quotes.
_______________________________________________________________________________
NDepend.Console.MultiOS.dll can be used to register a license on a machine,
or to start evaluation. Here are console arguments to use (case insensitive):
/RegEval Start the NDepend 14 days evaluation on the current machine.
_____________________________________________________________________________
/RegLic XYZ Register a seat of the license key XYZ on the current machine.
_____________________________________________________________________________
/UnregLic Unregister a seat of the license key already registered
on the current machine.
_____________________________________________________________________________
/RefreshLic Refresh the license data already registered on the current
machine. This is useful when the license changes upon renewal.
Each of these operation requires internet access to do a roundtrip with the
NDepend server. If the current machine doesn't have internet access
a procedure is proposed to complete the operation by accessing manually the
NDepend server from a connected machine.
_______________________________________________________________________________
Register a GitHub PAT with NDepend.Console.MultiOS.dll
A GitHub PAT (Personal Access Token) can be registered on a machine.
This way when NDepend needs to access GitHub, it can use such PAT.
Here are console arguments to use (case insensitive):
/RegGitHubPAT XYZ Register the GitHub PAT XYZ on the current machine.
_____________________________________________________________________________
/UnregGitHubPAT Unregister the GitHub PAT actually registered on the
current machine.
As explained above, when using NDepend.Console.MultiOS.dll to run an analysis,
a PAT can be provided with the switch GitHubPAT.
In such case, during analysis the PAT provided overrides the PAT
registered on the machine (if any).
As usual, a great amount of help and docs right there to help me get going.
I created the project for one of my microservices by pointing at the microservice solution file. (Despite not using Visual Studio myself, some of our devs do, so we maintain compatibility with both VS and VS Code. Plus, the C# Dev Kit really likes it when you have a solution.)
dotnet ~/ndepend/net8.0/NDepend.Console.MultiOS.dll --cp ./DemoProject.ndproj ~/path/to/my/Microservice.sln
This created a default NDepend project for analysis of my microservice solution. This is a pretty big file (513 lines of XML) so I won’t paste it here.
As noted in the online docs, right now if you want to modify this project, you can do so by hand; you can work with the NDepend API; or you can use the currently-Windows-only GUI. I’m not going to modify the project because I’m curious what I will get with the default. Obviously this won’t include various custom queries and metrics I may normally run for my specific projects, but that’s OK for this.
Let’s see this thing go!
dotnet ~/ndepend/net8.0/NDepend.Console.MultiOS.dll ./DemoProject.ndproj
This kicks off the analysis (like you might see on a build server) and generates a nice HTML report.
I didn’t include coverage data in this particular run because I wanted to focus mostly on the code analysis side of things.
Since my service code broke some rules, the command line exited non-zero. This is great for build integration where I want to fail if rules get violated.
From that main report page, it looks like the code in the service I analyzed failed some of the default quality gates. Let’s go to the Quality Gates tab to see what happened.
Yow! Four critical rules violated. I’ll click on that to see what they were.
Looks like there’s a type that’s too big, some mutually dependent namespaces, a non-readonly static field, and a couple of types that have the same name. Some of this is easy enough to fix; some of it might require some tweaks to the rules, since the microservice has some data transfer objects and API models that look different but have the same data (so the same name in different namespaces is appropriate).
All in all, not bad!
NDepend is still a great tool, even on Mac, and I still totally recommend it. To get the most out of it right now, you really need to be on Windows so you can get the GUI support, but for folks like me that are primarily Mac right now, it still provides some great value. Honestly, if you haven’t tried it yet, just go do that.
I always like providing some ideas on ways to make a good product even better, and this is no exception. I love this thing, and I want to see some cool improvements to make it “more awesomer.”
I’m very used to installing things through Homebrew on Mac, and on Windows as we look at things like Chocolatey, WinGet, and others - it seems like having an installation that would enable me to use these mechanisms instead of going to a download screen on a website would be a big help. I would love to be able to do brew install ndepend
and have that just work.
There’s some integration in Visual Studio for setting up projects and running NDepend on the current project. It’d be awesome to see similar integration for VS Code.
At the time of this writing, the NDepend getting started on Mac documentation says that this is coming. I’m looking forward to it.
I’m hoping that whatever comes out, the great GUI experience to view the various graphs and charts will also be coming for cross-platform. That’s a huge job, but it would be awesome, especially since I’m not really on any Windows machines anymore.
The cross-platform executable is a .dll
so running it is a somewhat long command line:
dotnet ~/path/to/net8.0/NDepend.Console.MultiOS.dll
It’d be nice if this was more… single-command, like ndepend-console
or something. Perhaps if it was a dotnet global tool it would be easier. That would also take care of the install mechanism - dotnet tool install ndepend-console -g
seems like it’d be pretty nifty.
The command line executable gets used to create projects, register licenses, and run analyses. I admit I’ve gotten used to commands taking command/sub-command hierarchies to help disambiguate the calls I’m making rather than having to mix-and-match command line arguments at the top. I think that’d be a nice improvement here.
For example, instead of…
dotnet ./net8.0/NDepend.Console.MultiOS.dll /reglic XXXXXXXX
dotnet ./net8.0/NDepend.Console.MultiOS.dll /unreglic
It could be…
dotnet ./net8.0/NDepend.Console.MultiOS.dll license register --code XXXXXXXX
dotnet ./net8.0/NDepend.Console.MultiOS.dll license unregister
That would mean when I need to create a project, maybe it’s under…
dotnet ./net8.0/NDepend.Console.MultiOS.dll project create [args]
And executing analysis might be under…
dotnet ./net8.0/NDepend.Console.MultiOS.dll analyze [args]
It’d make getting help a little easier, too, since the help could list the commands and sub-commands, with details being down at the sub-command level instead of right at the top.
Without the full GUI you don’t get to see the graphs like the dependency matrix that I love so much. Granted, these are far more useful if you can click on them and interact with them, but still, I miss them in the HTML.
NDepend came out long before Roslyn analyzers were a thing, and some of what makes NDepend shine are the great rules based on CQLinq - a much easier way to query for things in your codebase than trying to write a Roslyn analyzer.
It would be so sweet if the rules that could be analyzed at develop/build time - when we see Roslyn analyzer output - could actually be executed as part of the build. Perhaps it’d require pointing at an .ndproj
file to get the list of rules. Perhaps not all rules would be something that can be analyzed that early in the build. I’m just thinking about the ability to “shift left” a bit and catch the failing quality gates before running the analysis. That could potentially lead to a new/different licensing model where some developers, who are not authorized to run “full NDepend,” might have cheaper licenses that allow running of CQL-as-Roslyn-analyzer for build purposes.
Maybe an alternative to that would be to have a code generator that “creates a Roslyn analyzer package” based on CQL rules. Someone licensed for full NDepend could build that package and other devs could reference it.
I’m not sure exactly how it would work, I’m kinda brainstorming. But the “shift left” concept along with catching things early does appeal to me.
]]>This year we got to go to the party (no symptoms, even tested negative for COVID before walking out the door!) but ended up getting COVID for Halloween. That meant we didn’t hand out candy again, making this the second year in a row.
We did try to put a bowl of candy out with a “take one” sign. That didn’t last very long. While adults with small children were very good about taking one piece of candy per person, tweens and teens got really greedy really fast. We kind of expected that, but I’m always disappointed that people can’t just do the right thing; it’s always a selfish desire for more for me with no regard for you. Maybe that speaks to larger issues in society today? I dunno.
I need to start gathering ideas for next year’s costume. Since I reused a costume this year I didn’t really gather a lot of ideas or make anything, and I definitely missed that. On the other hand, my motivation lately has been a little low so it was also nice to not have to do anything.
]]>I used this opportunity to learn a little about how Homebrew formulae generally work. It wasn’t something where I had my own app to deploy, but it also wasn’t something I wanted to submit as a PR for an existing formula. For example, I wanted to have the bash
and wget
formulae use a different main URL (one of the mirrors). The current one works for 99% of folks, but for reasons I won’t get into, it wasn’t working for me.
This process is called “creating a tap” - it’s a repo you’ll own with your own stuff that won’t go into the core Homebrew repo.
TL;DR:
homebrew-XXXX
where XXXX
is how Homebrew will see your repo name..rb
extension will work - the name of the file is the name of the formula.brew install your-username/XXXX/formula.rb
Let’s get a little more specific and use an example.
First I created my GitHub repo, homebrew-mods
. This is where I can store my customized formulae. In there, I created a Formula
folder to put them in.
I went to the homebrew-core
repo where all the main formulae are and found the ones I was interested in updating:
I copied the formulae into my own repo and made some minor updates to switch the url
and mirror
values around a bit.
Finally, install time! It has to be installed in this order because otherwise the dependencies in the bash
and wget
modules will try to pull from homebrew-core
instead of my mod repo.
brew install tillig/mods/gettext
brew install tillig/mods/bash
brew install tillig/mods/libidn2
brew install tillig/mods/wget
That’s it! If other packages have dependencies on gettext
or libidn2
, it’ll appear to be already installed since Homebrew just matches on name.
The downside of this approach is that you won’t get the upgrades for free. You have to maintain your tap and pull version updates as needed.
If you want to read more, check out the documentation from Homebrew on creating and maintaining a tap as well as the formula cookbook.
]]>BIGGEST DISCLAIMER YOU HAVE EVER SEEN: THIS IS UNSUPPORTED. Not just “unsupported by me” but, in a lot of cases, unsupported by the community. For example, we’ll be installing Homebrew in a custom location, and they have no end of warnings about how unsupported that is. They won’t even take tickets or PRs to fix it if something isn’t working. When you take this on, you need to be ready to do some troubleshooting, potentially at a level you’ve not had to dig down to before. Don’t post questions, don’t file issues - you are on your own, 100%, no exceptions.
OK, hopefully that was clear. Let’s begin.
The key difference in what I’m doing here is that everything goes into your user folder somewhere.
/usr/local/bin
style location./Applications
or /usr/share
./etc/paths.d
or anything like that.Contents:
The TL;DR here is a set of strategies:
/usr/local/bin
or anything else under /usr/local
, we’re going to create that whole structure under ~/local
- ~/local/bin
and so on.~/Applications
instead of /Applications
.~/.profile
for paths and environment. No need for /etc/paths.d
. Also, ~/.profile
is pretty cross-shell (e.g., both bash
and pwsh
obey it) so it’s a good central way to go.npm install -g
or dotnet tool install -g
if you can’t find something in Homebrew.First things first, you need Git. This is the only thing that you may have challenges with. Without admin I was able to install Xcode from the App Store and that got me git
. I admit I forgot to even check to see if git
just ships with MacOS now. Maybe it does. But you will need Xcode command line tools for some stuff with Homebrew anyway, so I’d say just install Xcode to start. If you can’t… hmmm. You might be stuck. You should at least see what you can do about getting git
. You’ll only use this version temporarily until you can install the latest using Homebrew later.
Got Git? Good. Let’s get Homebrew installed.
mkdir -p ~/local/bin
cd ~/local
git clone https://github.com/Homebrew/brew Homebrew
ln -s ~/local/Homebrew/bin/brew ~/local/bin/brew
I’ll reiterate - and you’ll see it if you ever run brew doctor
- that this is wildly unsupported. It works, but you’re going to see some things here that you wouldn’t normally see with a standard Homebrew install. For example, things seem to compile a lot more often than I remember with regular Homebrew - and this is something they mention in the docs, too.
Now we need to add some stuff to your ~/.profile
so we can get the shell finding your new ~/local
tools. We need to do that before we install more stuff via Homebrew. That means we need an editor. I know you could use vi
or something, but I’m a VS Code guy, and I need that installed anyway.
Let’s get VS Code. Go download it from the download page, unzip it, and drop it in your ~/Applications
folder. At a command prompt, link it into your ~/local/bin
folder:
ln -s '~/Applications/Visual Studio Code.app/Contents/Resources/app/bin/code' ~/local/bin/code
I was able to download this one with a browser without running into Gatekeeper trouble. If you get Gatekeeper arguing with you about it, use curl
to download.
You can now do ~/local/bin/code ~/.profile
to edit your base shell profile. Add this line so Homebrew can put itself into the path and set various environment variables:
eval "$($HOME/local/bin/brew shellenv)"
Restart your shell so this will evaluate and you now should be able to do:
brew --version
Your custom Homebrew should be in the path and you should see the version of Homebrew installed. We’re in business!
We can install more Homebrew tools now that custom Homebrew is set up. Here are the tools I use and the rough order I set them up. Homebrew is really good about managing the dependencies so it doesn’t have to be in this order, but be aware that a long dependency chain can mean a lot of time spent doing some custom builds during the install and this general order keeps it relatively short.
# Foundational utilities
brew install ca-certificates
brew install grep
brew install jq
# Bash and wget updates
brew install gettext
brew install bash
brew install libidn2
brew install wget
# Terraform - I use tfenv to manage installs/versions. This will
# install the latest Terraform.
brew install tfenv
tfenv install
# Terrragrunt - I use tgenv to manage installs/versions. After you do
# `list-remote`, pick a version to install.
brew install tgenv
tgenv list-remote
# Go
brew install go
# Python
brew install python@3.10
# Kubernetes
brew install kubernetes-cli
brew install k9s
brew install krew
brew install Azure/kubelogin/kubelogin
brew install stern
brew install helm
brew install helmsman
# Additional utilities I like
brew install marp-cli
brew install mkcert
brew install pre-commit
If you installed the grep
update or python
, you’ll need to add them to your path manually via the ~/.profile
. We’ll do that just before the Homebrew part, then restart the shell to pick up the changes.
export PATH="$HOME/local/opt/grep/libexec/gnubin:$HOME/local/opt/python@3.10/libexec/bin:$PATH"
eval "$($HOME/local/bin/brew shellenv)"
This one was more challenging because the default installer they provide requires admin permissions so you can’t just download and run it or install via Homebrew. But I’m a PowerShell guy, so here’s how that one worked:
First, find the URL for the the .tar.gz
from the releases page for your preferred PowerShell version and Mac architecture. I’m on an M1 so I’ll get the arm64
version.
cd ~/Downloads
curl -fsSL https://github.com/PowerShell/PowerShell/releases/download/v7.3.7/powershell-7.3.7-osx-arm64.tar.gz -o powershell.tar.gz
mkdir -p ~/local/microsoft/powershell/7
tar -xvf ./powershell.tar.gz -C ~/local/microsoft/powershell/7
chmod +x ~/local/microsoft/powershell/7/pwsh
ln -s '~/local/microsoft/powershell/7/pwsh' ~/local/bin/pwsh
Now you have a local copy of PowerShell and it’s linked into your path.
An important note here - I used curl
instead of my browser to download the .tar.gz
file. I did that to avoid Gatekeeper.
You use Homebrew to install the Azure CLI and then use az
itself to add extensions. I separated this one out from the other Homebrew tools, though, because there’s a tiny catch: When you install az
CLI, it’s going to build openssl
from scratch because you’re in a non-standard location. During the tests for that build, it may try to start listening to network traffic. If you don’t have rights to allow that test to run, just hit cancel/deny. It’ll still work.
brew install azure-cli
az extension add --name azure-devops
az extension add --name azure-firewall
az extension add --name fleet
az extension add --name front-door
I use n
to manage my Node versions/installs. n
requires us to set an environment variable N_PREFIX
so it knows where to install things. First install n
via Homebrew:
brew install n
Now edit your ~/.profile
and add the N_PREFIX
variable, then restart your shell.
export N_PREFIX="$HOME/local"
export PATH="$HOME/local/opt/grep/libexec/gnubin:$HOME/local/opt/python@3.10/libexec/bin:$PATH"
eval "$($HOME/local/bin/brew shellenv)"
After that shell restart, you can start installing Node versions. This will install the latest:
n latest
Once you have Node.js installed, you can install Node.js-based tooling.
# These are just tools I use; install the ones you use.
npm install -g @stoplight/spectral-cli `
gulp-cli `
tfx-cli `
typescript
I use rbenv
to manage my Ruby versions/installs. rbenv
requires both an installation and a modification to your ~/.profile
. If you use rbenv
…
# Install it, and install a Ruby version.
brew install rbenv
rbenv init
rbenv install -l
Update your ~/.profile
to include the rbenv
shell initialization code. It’ll look like this, put just after the Homebrew bit. Note I have pwsh
in there as my shell of choice - put your own shell in there (bash
, zsh
, etc.). Restart your shell when it’s done.
export N_PREFIX="$HOME/local"
export PATH="$HOME/local/opt/grep/libexec/gnubin:$HOME/local/opt/python@3.10/libexec/bin:$PATH"
eval "$($HOME/local/bin/brew shellenv)"
eval "$($HOME/local/bin/rbenv init - pwsh)"
The standard installers for the .NET SDK require admin permissions because they want to go into /usr/local/share/dotnet
.
Download the dotnet-install.sh
shell script and stick that in your ~/local/bin
folder. What’s nice about this script is it will install things to ~/.dotnet
by default instead of the central share location.
# Get the install script
curl -fsSL https://dot.net/v1/dotnet-install.sh -o ~/local/bin/dotnet-install.sh
chmod +x ~/local/bin/dotnet-install.sh
We need to get the local .NET into the path and set up variables (DOTNET_INSTALL_DIR
and DOTNET_ROOT
) so .NET and the install/uninstall processes can find things. We’ll add that all to our ~/.profile
and restart the shell.
export DOTNET_INSTALL_DIR="$HOME/.dotnet"
export DOTNET_ROOT="$HOME/.dotnet"
export N_PREFIX="$HOME/local"
export PATH="$HOME/local/opt/grep/libexec/gnubin:$DOTNET_ROOT:$DOTNET_ROOT/tools:$HOME/local/opt/python@3.10/libexec/bin:$PATH"
eval "$($HOME/local/bin/brew shellenv)"
eval "$($HOME/local/bin/rbenv init - pwsh)"
Note we did not grab the .NET uninstall tool. It doesn’t work without admin permissions. When you try to run it doing anything but listing what’s installed, you get:
The current user does not have adequate privileges. See https://aka.ms/dotnet-core-uninstall-docs.
It’s unclear why uninstall would require admin privileges since install did not. I’ve filed an issue about that.
After the shell restart, we can start installing .NET and .NET global tools. In particular, this is how I get the Git Credential Manager plugin.
# Install latest .NET 6.0, 7.0, 8.0
dotnet-install.sh -?
dotnet-install.sh -c 6.0
dotnet-install.sh -c 7.0
dotnet-install.sh -c 8.0
# Get Git Credential Manager set up.
dotnet tool install -g git-credential-manager
git-credential-manager configure
# Other .NET tools I use. You may or may not want these.
dotnet tool install -g dotnet-counters
dotnet tool install -g dotnet-depends
dotnet tool install -g dotnet-dump
dotnet tool install -g dotnet-format
dotnet tool install -g dotnet-guid
dotnet tool install -g dotnet-outdated-tool
dotnet tool install -g dotnet-script
dotnet tool install -g dotnet-svcutil
dotnet tool install -g dotnet-symbol
dotnet tool install -g dotnet-trace
dotnet tool install -g gti
dotnet tool install -g microsoft.web.librarymanager.cli
Without admin, you can’t get the system Java wrappers to be able to find any custom Java you install because you can’t run the required command like: sudo ln -sfn ~/local/opt/openjdk/libexec/openjdk.jdk /Library/Java/JavaVirtualMachines/openjdk.jdk
If you use bash
or zsh
as your shell, you might be interested in SDKMAN! as a way to manage Java. I use PowerShell so this won’t work because SDKMAN! relies on shell functions to do a lot of its job.
Instead, we’ll install the appropriate JDK and set symlinks/environment variables.
brew install openjdk
In .profile
, we’ll need to set JAVA_HOME
and add OpenJDK to the path. If we install a different JDK, we can update JAVA_HOME
and restart the shell to switch.
export DOTNET_INSTALL_DIR="$HOME/.dotnet"
export DOTNET_ROOT="$HOME/.dotnet"
export N_PREFIX="$HOME/local"
export JAVA_HOME="$HOME/local/opt/openjdk"
export PATH="$JAVA_HOME/bin:$HOME/local/opt/grep/libexec/gnubin:$DOTNET_ROOT:$DOTNET_ROOT/tools:$HOME/local/opt/python@3.10/libexec/bin:$PATH"
eval "$($HOME/local/bin/brew shellenv)"
eval "$($HOME/local/bin/rbenv init - pwsh)"
If you use Azure DevOps Artifacts, the credential provider is required for NuGet to restore packages. There’s a script that will help you download and install it in the right spot, and it doesn’t require admin.
wget -qO- https://aka.ms/install-artifacts-credprovider.sh | bash
If you download things to install, be aware Gatekeeper may get in the way.
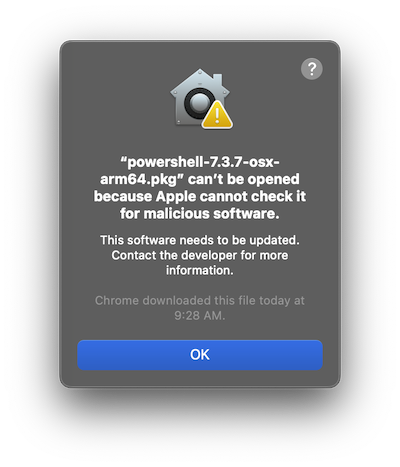
You get messages like “XYZ can’t be opened because Apple cannot check it for malicious software.” This happened when I tried to install PowerShell by downloading the .tar.gz
using my browser. The browser adds an attribute to the downloaded file and prompts you before running it. Normally you can just approve it and move on, but I don’t have permissions for that.
To fix it, you have to use the xattr
tool to remove the com.apple.quarantine
attribute from the affected file(s).
xattr -d com.apple.quarantine myfile.tar.gz
An easier way to deal with it is to just don’t download things with a browser. If you use curl
to download, you don’t get the attribute added and you won’t get prompted.
Some packages installed by Homebrew (like PowerShell) try to run an installer that requires admin permissions. In some cases you may be able to find a different way to install the tool like I did with PowerShell. In some cases, like Docker, you need the admin permissions to set that up. I don’t have workarounds for those sorts of things.
There are some tools that may require additional permissions by nature, like Rectangle needs to be allowed to control window placement and I don’t have permissions to grant that. I don’t have workarounds for those sorts of things.
Some Homebrew installs will dump completions into ~/local/etc/bash_completions.d
. I never really did figure out what to do about these since I don’t really use Bash. There’s some doc about options you have but I’m not going to dig into it.
Since you’ve only updated your path and environment from your shell profile (e.g., not /etc/paths
or whatever), these changes won’t be available unless you’re running things from your login shell.
A great example is VS Code and build tools. Let’s say you have a build set up where the command
is npm
. If the path to npm
is something you added in your ~/.profile
, VS Code may not be able to find it.
code
from your shell, it will inherit the environment and npm
will be found.npm
will not be found.You can mitigate a little of this, at least in VS Code, by:
terminal.integrated.profiles.osx
profiles to pass -l
as an argument (act as a login shell, process ~/.profile
) as shown in this Stack Overflow answer.terminal.integrated.automationProfile.osx
profile to also pass -l
as an argument to your shell. (You may or may not need to do this; I was able to get away without it.)"type": "shell"
in tasks.json
) for things instead of letting it default to "type": "process"
.Other tools will, of course, require other workarounds.
Hopefully this gets you bootstrapped into a dev machine without requiring admin permissions. I didn’t cover every tool out there, but perhaps you can apply the strategies to solving any issues you run across. Good luck!
]]>pre-commit
, and I really dig it. It’s a great way to double-check basic linting and validity in things without having to run a full build/test cycle.
Something I commonly do is sort JSON files using json-stable-stringify
. I even wrote a VS Code extension to do just that. The problem with it being locked in the VS Code extension is that it’s not something I can use to verify formatting or invoke outside of the editor, so I set out to fix that. The result: @tillig/json-sort-cli
.
This is a command-line wrapper around json-stable-stringify
which adds a couple of features:
.editorconfig
- which is also something the VS Code plugin does.json5
for parsing) but it will remove those comments on format.I put all of that together and included configuration for pre-commit
so you can either run it manually via CLI or have it automatically run at pre-commit time.
I do realize there is already a pretty-format-json
hook, but the above features I mentioned are differentiators. Why not just submit PRs to enhance the existing hook? The existing hook is in Python (not a language I’m super familiar with) and I really wanted - explicitly - the json-stable-stringify
algorithm here, which I didn’t want to have to re-create in Python. I also wanted to add .editorconfig
support and ability to use json5
to parse, which I suppose is all technically possible in Python but not a hill I really wanted to climb. Also, I wanted to offer a standalone CLI, which isn’t something I can do with that hook.
This is my first real npm package I’ve published, and I did it without TypeScript (I’m not really a JS guy, but to work with pre-commit
you need to be able to install right from the repo), so I’m pretty pleased with it. I learned a lot about stuff I haven’t really dug into in the past - from some new things around npm packaging to how to get GitHub Actions to publish the package (with provenance) on release.
If this sounds like something you’re into, go check out how you can install and start using it!
]]>I also find that I do a lot of my work at the command line (in PowerShell!) and I was missing a command that would do the same thing from there.
Luckily, the code that does the work in the GitLens plugin is MIT License so I dug in and converted the general logic into a PowerShell command.
# Open the current clone's `origin` in web view.
Open-GitRemote
# Specify the location of the clone.
Open-GitRemote ~/dev/my-clone
# Pick a different remote.
Open-GitRemote -Remote upstream
If you’re interested, I’ve added the cmdlet to my PowerShell profile repository which is also under MIT License, so go get it!
]]>Note: At the time of this writing I only have Windows and MacOS support - I didn’t get the Linux support in, but I think
xdg-open
is probably the way to go there. I just can’t test it. PRs welcome!
We discovered a slow leak in one of the walls in our kitchen that caused some of our hardwood floor to warp, maybe a little more than a square meter. Since this was a very slow leak over time, insurance couldn’t say “here’s the event that caused it” and, thus, chalked it up to “normal wear and tear” which isn’t covered.
You can’t fix just a small section of a hardwood floor and we’ve got like 800 square feet of contiguous hardwood, so… all 800 square feet needed to be fully sanded and refinished. All out of pocket. We packed the entire first floor of the house into the garage and took a much-needed vacation to Universal Studios California and Disneyland for a week while the floor was getting refinished.
I had planned on putting the house back together, decorating, and getting right into Halloween when we came back. Unfortunately, when we got back we saw the floor was not done too well. Lots of flaws and issues in the work. It’s getting fixed, but it means we didn’t get to empty out the garage, which means I couldn’t get to the Halloween decorations. Between work and stress and everything else… candy just wasn’t in the cards. Sorry kids. Next year.
But we did make costumes - and we wore them in 90 degree heat in California for the Disney “Oogie Boogie Bash” party. So hot, but still very fun.
I used this Julie-Chantal pattern for a Jedi costume and it is really good. I’m decent at working with and customizing patterns, I’m not so great with drafting things from scratch.
I used a cotton gauze for the tunic, tabard, and sash. The robe is a heavy-weave upholstery fabric that has a really nice feel to it.
I added some magnet closures to it so it would stick together a bit nicer as well as some snaps to stick things in place. I definitely found while wearing it that it was required. All the belts and everything have a tendency to move a lot as you walk, sit, and stand. I think it turned out nicely, though.
The whole family went in Star Wars garb. I don’t have a picture of Phoenix, but here’s me and Jenn at a Halloween party. Phoenix and Jenn were both Rey, but from different movies. You can’t really tell, but Jenn’s vest is also upholstery fabric with an amazing, rich texture. She did a great job on her costume, too.
]]>First, get your OS build number: 🍎 -> About This Mac -> More Info.
Click on the Version XX.X field and it should expand to show you the build number. It will be something like 22A380
.
Go to the software catalog for Rosetta and search for your build number. You should see your build-specific package. The build number is in ExtendedMetaInfo
:
<dict>
<key>ServerMetadataURL</key>
<string>https://swcdn.apple.com/content/downloads/38/00/012-92132-A_1NEH9AKCK9/k8s821iao7kplkdvqsovfzi49oi54ljrar/RosettaUpdateAuto.smd</string>
<key>Packages</key>
<array>
<dict>
<key>Digest</key>
<string>dac241ee3db55ea602540dac036fd1ddc096bc06</string>
<key>Size</key>
<integer>331046</integer>
<key>MetadataURL</key>
<string>https://swdist.apple.com/content/downloads/38/00/012-92132-A_1NEH9AKCK9/k8s821iao7kplkdvqsovfzi49oi54ljrar/RosettaUpdateAuto.pkm</string>
<key>URL</key>
<string>https://swcdn.apple.com/content/downloads/38/00/012-92132-A_1NEH9AKCK9/k8s821iao7kplkdvqsovfzi49oi54ljrar/RosettaUpdateAuto.pkg</string>
</dict>
</array>
<key>ExtendedMetaInfo</key>
<dict>
<key>ProductType</key>
<string>otherArchitectureHandlerOS</string>
<key>BuildVersion</key>
<string>22A380</string>
</dict>
</dict>
Look for the URL value (the .pkg
file). Download and install that. Rosetta will be updated.
<Compile Remove>
solution I had to do to get around the CS2002
warning. I got a good comment that explained some of the things I didn’t catch from the original issue about strongly-typed resource generation (which is a very long issue). I’ve updated the code/article to include the fixes and have a complete example.
In the not-too-distant past I switched from using Visual Studio for my full-time .NET IDE to using VS Code. No, it doesn’t give me quite as much fancy stuff, but it feels a lot faster and it’s nice to not have to switch to different editors for different languages.
Something I noticed, though, was that if I updated my *.resx
files in VS Code, the associated *.Designer.cs
was not getting auto-generated. There is a GitHub issue for this and it includes some different solutions to the issue involving some .csproj
hackery, but it’s sort of hard to parse through and find the thing that works.
Here’s how you can get this to work for both Visual Studio and VS Code.
<Project Sdk="Microsoft.NET.Sdk">
<PropertyGroup>
<!--
Target framework doesn't matter, but this solution is tested with
.NET 6 SDK and above.
-->
<TargetFrameworks>net6.0</TargetFrameworks>
<!--
This is required because OmniSharp (VSCode) calls the build in a way
that will skip resource generation. Without this line, OmniSharp won't
find the generated .cs files and analysis will fail.
-->
<CoreCompileDependsOn>PrepareResources;$(CompileDependsOn)</CoreCompileDependsOn>
</PropertyGroup>
<ItemGroup>
<!--
Here's the magic. You need to specify everything for the generated
designer file - the filename, the language, the namespace, and the
class name.
-->
<EmbeddedResource Update="MyResources.resx">
<!-- Tell Visual Studio that MSBuild will do the generation. -->
<Generator>MSBuild:Compile</Generator>
<LastGenOutput>MyResources.Designer.cs</LastGenOutput>
<!-- Put generated files in the 'obj' folder. -->
<StronglyTypedFileName>$(IntermediateOutputPath)\MyResources.Designer.cs</StronglyTypedFileName>
<StronglyTypedLanguage>CSharp</StronglyTypedLanguage>
<StronglyTypedNamespace>Your.Project.Namespace</StronglyTypedNamespace>
<StronglyTypedClassName>MyResources</StronglyTypedClassName>
</EmbeddedResource>
<!--
If you have resources in a child folder it still works, but you need to
make sure you update the StronglyTypedFileName AND the
StronglyTypedNamespace.
-->
<EmbeddedResource Update="Some\Sub\Folder\OtherResources.resx">
<Generator>MSBuild:Compile</Generator>
<LastGenOutput>OtherResources.Designer.cs</LastGenOutput>
<!-- Make sure this won't clash with other generated files! -->
<StronglyTypedFileName>$(IntermediateOutputPath)\OtherResources.Designer.cs</StronglyTypedFileName>
<StronglyTypedLanguage>CSharp</StronglyTypedLanguage>
<StronglyTypedNamespace>Your.Project.Namespace.Some.Sub.Folder</StronglyTypedNamespace>
<StronglyTypedClassName>OtherResources</StronglyTypedClassName>
</EmbeddedResource>
</ItemGroup>
</Project>
Additional tips:
Once you have this in place, you can .gitignore
any *.Designer.cs
files and remove them from source. They’ll be regenerated by the build, but if you leave them checked in then the version of the generator that Visual Studio uses will fight with the version of the generator that the CLI build uses and you’ll get constant changes. The substance of the generated code is the same, but file headers may be different.
You can use VS Code file nesting to nest localized *.resx
files under the main *.resx
files with this config. Note you won’t see the *.Designer.cs
files in there because they’re going into the obj
folder.
{
"explorer.fileNesting.enabled": true,
"explorer.fileNesting.patterns": {
"*.resx": "$(capture).*.resx, $(capture).designer.cs, $(capture).designer.vb"
}
}
WARNING: An illegal reflective access operation has occurred
WARNING: Illegal reflective access by com.google.inject.internal.cglib.core.$ReflectUtils$1 (file:/agent/_work/_tasks/NexusIqPipelineTask_4f40d1a2-83b0-4ddc-9a77-e7f279eb1802/1.4.0/resources/nexus-iq-cli-1.143.0-01.jar) to method java.lang.ClassLoader.defineClass(java.lang.String,byte[],int,int,java.security.ProtectionDomain)
WARNING: Please consider reporting this to the maintainers of com.google.inject.internal.cglib.core.$ReflectUtils$1
WARNING: Use --illegal-access=warn to enable warnings of further illegal reflective access operations
WARNING: All illegal access operations will be denied in a future release
The task, internally, just runs java
to execute the Sonatype scanner JAR/CLI. The warnings here are because that JAR assumes JDK 8 and the default JDK on an Azure DevOps agent is later than that.
The answer is to set JDK 8 before running the scan.
# Install JDK 8
- task: JavaToolInstaller@0
inputs:
versionSpec: '8'
jdkArchitectureOption: x64
jdkSourceOption: PreInstalled
# Then run the scan
- task: NexusIqPipelineTask@1
inputs:
nexusIqService: my-service-connection
applicationId: my-application-id
stage: "Release"
scanTargets: my-scan-targets
public class Source
{
public Source();
public string Description { get; set; }
public DateTimeOffset? ExpireDateTime { get; set; }
public string Value { get; set; }
}
…into an object needed for a system we’re integrating with.
public class Destination
{
public Destination();
public Destination(string value, DateTime? expiration = null);
public Destination(string value, string description, DateTime? expiration = null);
public string Description { get; set; }
public DateTime? Expiration { get; set; }
public string Value { get; set; }
}
It appeared to me that the most difficult thing here was going to be mapping ExpireDateTime
to Expiration
. Unfortunately, this was more like a three-hour tour.
I started out creating the mapping like this (in a mapping Profile
):
// This is not the answer.
this.CreateMap<Source, Destination>()
.ForMember(dest => dest.Expiration, opt.MapFrom(src => src.ExpireDateTime));
This didn’t work because there’s no mapping from DateTimeOffset?
to DateTime?
. I next made a mistake that I think I make every time I run into this and have to relearn it, which is that I created that mapping, too.
// Still not right.
this.CreateMap<Source, Destination>()
.ForMember(dest => dest.Expiration, opt.MapFrom(src => src.ExpireDateTime));
this.CreateMap<DateTimeOffset?, DateTime?>()
.ConvertUsing(input => input.HasValue ? input.Value.DateTime : null);
It took a few tests to realize that AutoMapper handles nullable for you, so I was able to simplify a bit.
// Getting closer - don't map nullable, map the base type.
this.CreateMap<Source, Destination>()
.ForMember(dest => dest.Expiration, opt.MapFrom(src => src.ExpireDateTime));
this.CreateMap<DateTimeOffset, DateTime>()
.ConvertUsing(input => input.DateTime);
However, it seemed that no matter what I did, the Destination.Expiration
was always null. For the life of me, I couldn’t figure it out.
Then I had one of those “eureka” moments when I was thinking about how Autofac handles constructors: It chooses the constructor with the most parameters that it can fulfill from the set of registered services.
I looked again at that Destination
object and realized there were three constructors, two of which default the Expiration
value to null. AutoMapper also handles constructors in a way similar to Autofac. From the docs about ConstructUsing
:
AutoMapper will automatically match up destination constructor parameters to source members based on matching names, so only use this method if AutoMapper can’t match up the destination constructor properly, or if you need extra customization during construction.
That’s it! The answer is to pick the zero-parameter constructor so the mapping isn’t skipped.
// This is the answer!
this.CreateMap<Source, Destination>()
.ForMember(dest => dest.Expiration, opt.MapFrom(src => src.ExpireDateTime))
.ConstructUsing((input, context) => new Destination());
this.CreateMap<DateTimeOffset, DateTime>()
.ConvertUsing(input => input.DateTime);
Hopefully that will save you some time if you run into it. Also, hopefully it will save me some time next time I’m stumped because I can search and find my own blog… which happens more often than you might think.
]]>Halloween was on a Sunday and it was chilly and windy. It had been raining a bit but didn’t rain during prime trick-or-treat time.
We didn’t hand out candy last year due to the COVID-19 outbreak. Looking up and down our street, it appeared a lot of people chose again this year to not hand out candy. We also saw some “take one” bowls on porches and various creative “candy torpedo tubes” that would send candy from the porch to the kid in a distanced fashion.
Cumulative data:
Time Block | ||||||
---|---|---|---|---|---|---|
Year | 6:00p - 6:30p | 6:30p - 7:00p | 7:00p - 7:30p | 7:30p - 8:00p | 8:00p - 8:30p | Total |
2006 | 52 | 59 | 35 | 16 | 0 | 162 |
2007 | 5 | 45 | 39 | 25 | 21 | 139 |
2008 | 14 | 71 | 82 | 45 | 25 | 237 |
2009 | 17 | 51 | 72 | 82 | 21 | 243 |
2010 | 19 | 77 | 76 | 48 | 39 | 259 |
2011 | 31 | 80 | 53 | 25 | 0 | 189 |
2013 | 28 | 72 | 113 | 80 | 5 | 298 |
2014 | 19 | 54 | 51 | 42 | 10 | 176 |
2015 | 13 | 14 | 30 | 28 | 0 | 85 |
2016 | 1 | 59 | 67 | 57 | 0 | 184 |
2019 | 1 | 56 | 59 | 41 | 33 | 190 |
2021 | 16 | 37 | 30 | 50 | 7 | 140 |
Our costumes this year:
PATH
for your shell - whichever shell you like - was easy. But then I got into a situation where I started using more than one shell on a regular basis (both PowerShell and Bash) and things started to break down quickly.
Specifically, I have some tools that are installed in my home directory. For example, .NET global tools get installed at ~/.dotnet/tools
and I want that in my path. I would like this to happen for any shell I use, and I have multiple user accounts on my machine for testing scenarios so I’d like it to ideally be a global setting, not something I have to configure for every user.
This is really hard.
I’ll gather some of my notes here on various tools and strategies I use to set paths. It’s (naturally) different based on OS and shell.
This probably won’t be 100% complete, but if you have an update, I’d totally take a PR on this blog entry.
Each shell has its own mechanism for setting up profile-specific values. In most cases this is the place you’ll end up setting user-specific paths - paths that require a reference to the user’s home directory. On Mac and Linux, the big takeaway is to use /etc/profile
. Most shells appear to interact with that file on some level.
PowerShell has a series of profiles that range from system level (all users, all hosts) through user/host specific (current user, current host). The one I use the most is “current user, current host” because I store my profile in a Git repo and pull it into the correct spot on my local machine. I don’t currently modify the path from my PowerShell profile.
/etc/profile
and ~/.profile
, then subsequently use its own profiles for the path. On Mac this includes evaluation of the path_helper
output. (See the Mac section below for more on path_helper
.) I say “appears to evaluate” because I can’t find any documentation on it, yet that’s the behavior I’m seeing. I gather this is likely due to something like a login shell (say zsh
) executing first and then having that launch pwsh
, which inherits the variables. I’d love a PR on this entry if you have more info.If you want to use PowerShell as a login shell, on Mac and Linux you can provide the -Login
switch (as the first switch when running pwsh
!) and it will execute sh
to include /etc/profile
and ~/.profile
execution before launching the PowerShell process. See Get-Help pwsh
for more info on that.
Bash has a lot of profiles and rules about when each one gets read. Honestly, it’s pretty complex and seems to have a lot to do with backwards compatibility with sh
along with need for more flexibility and override support.
/etc/profile
seems to be the way to globally set user-specific paths. After /etc/profile
, things start getting complex, like if you have a .bash_profile
then your .profile
will get ignored.
zsh is the default login shell on Mac. It has profiles at:
/etc/zshrc
and ~/.zshrc
/etc/zshenv
and ~/.zshenv
/etc/zprofile
and ~/.zprofile
It may instead use /etc/profile
and ~/.profile
if it’s invoked in a compatibility mode. In this case, it won’t execute the zsh profile files and will use the sh
files instead. See the manpage under “Compatibility” for details or this nice Stack Overflow answer.
I’ve set user-specific paths in /etc/profile
and /etc/zprofile
, which seems to cover all the bases depending on how the command gets invoked.
Windows sets all paths in the System => Advanced System Settings => Environment Variables control panel. You can set system or user level environment variables there.
The Windows path separator is ;
, which is different than Mac and Linux. If you’re building a path with string concatenation, be sure to use the right separator.
I’ve lumped these together because, with respect to shells and setting paths, things are largely the same. The only significant difference is that Mac has a tool called path_helper
that is used to generate paths from a file at /etc/paths
and files inside the folder /etc/paths.d
. Linux doesn’t have path_helper
.
The file format for /etc/paths
and files in /etc/paths.d
is plain text where each line contains a single path, like:
/usr/local/bin
/usr/bin
/bin
/usr/sbin
/sbin
Unfortunately, path_helper
doesn’t respect the use of variables - it will escape any $
it finds. This is a good place to put global paths, but not great for user-specific paths.
In /etc/profile
there is a call to path_helper
to evaluate the set of paths across these files and set the path. I’ve found that just after that call is a good place to put “global” user-specific paths.
if [ -x /usr/libexec/path_helper ]; then
eval `/usr/libexec/path_helper -s`
fi
PATH="$PATH:$HOME/go/bin:$HOME/.dotnet/tools:$HOME/.krew/bin"
Regardless of whether you’re on Mac or Linux, /etc/profile
seems to be the most common place to put these settings. Make sure to use $HOME
instead of ~
to indicate the home directory. The ~
won’t get expanded and can cause issues down the road.
If you want to use zsh
, you’ll want the PATH
set block in both /etc/profile
and /etc/zprofile
so it handles any invocation.
The Mac and Linux path separator is :
, which is different than Windows. If you’re building a path with string concatenation, be sure to use the right separator.
I have a Kubernetes cluster with Istio installed. My Istio ingress gateway is connected to an Apigee API management front-end via mTLS. Requests come in to Apigee then get routed to a secured public IP address where only Apigee is authorized to connect.
Unfortunately, this results in all requests coming in with the same Host
header:
api.services.com/v1/resource/operation
.1.2.3.4/v1/resource/operation
via the Istio ingress gateway and mTLS.VirtualService
answers to hosts: "*"
(any host header at all) and matches entirely on URL path - if it’s /v1/resource/operation
it routes to mysvc.myns.svc.cluster.local/resource/operation
.This is how the ingress tutorial on the Istio site works, too. No hostname-per-service.
However, there are a couple of wrenches in the works, as expected:
The combination of these things is a problem. I can’t assume that the match-on-path-regex setting will work for internal traffic - I need any internal service to route properly based on host name. However, you also can’t match on host: "*"
for internal traffic that doesn’t come through an ingress. That means I would need two different VirtualService
instances - one for internal traffic, one for external.
But if I have two different VirtualService
objects to manage, it means I need to keep them in sync over the canary, which kind of sucks. I’d like to set the traffic balancing in one spot and have it work for both internal and external traffic.
I asked how to do this on the Istio discussion forum and thought for a while that a VirtualService
delegate
would be the answer - have one VirtualService
with the load balancing information, a second service for internal traffic (delegating to the load balancing service), and a third service for external traffic (delegating to the load balancing service). It’s more complex, but I’d get the ability to control traffic in one spot.
Unfortunately (the word “unfortunately” shows up a lot here, doesn’t it?), you can’t use delegates on a VirtualService
that doesn’t also connect to a gateway
. That is, if it’s internal/mesh
traffic, you don’t get the delegate support. This issue in the Istio repo touches on that.
Here’s where I landed.
First, I updated Apigee so it takes care of two things for me:
Service-Host
header with the internal host name of the target service, like Service-Host: mysvc.myns.svc.cluster.local
. It more tightly couples the Apigee part of things to the service internal structure, but it frees me up from having to route entirely by regex in the cluster. (You’ll see why in a second.) I did try to set the Host
header directly, but Apigee overwrites this when it issues the request on the back end./v1/resource/operation
to be /resource/operation
, that path update happens in Apigee so the inbound request will have the right path to start.I did the Service-Host
header with an “AssignMessage” policy.
<?xml version="1.0" encoding="UTF-8" standalone="yes"?>
<AssignMessage async="false" continueOnError="false" enabled="true" name="Add-Service-Host-Header">
<DisplayName>Add Service Host Header</DisplayName>
<Set>
<Headers>
<Header name="Service-Host">mysvc.myns.svc.cluster.local</Header>
</Headers>
</Set>
<IgnoreUnresolvedVariables>true</IgnoreUnresolvedVariables>
<AssignTo createNew="false" transport="http" type="request"/>
</AssignMessage>
Next, I added an Envoy filter to the Istio ingress gateway so it knows to look for the Service-Host
header and update the Host
header accordingly. Again, I used Service-Host
because I couldn’t get Apigee to properly set Host
directly. If you can figure that out and get the Host
header coming in correctly the first time, you can skip the Envoy filter.
The filter needs to run first thing in the pipeline, before Istio tries to route traffic. I found that pinning it just before the istio.metadata_exchange
stage got the job done.
apiVersion: networking.istio.io/v1alpha3
kind: EnvoyFilter
metadata:
name: propagate-host-header-from-apigee
namespace: istio-system
spec:
workloadSelector:
labels:
istio: ingressgateway
app: istio-ingressgateway
configPatches:
- applyTo: HTTP_FILTER
match:
context: GATEWAY
listener:
filterChain:
filter:
name: "envoy.http_connection_manager"
subFilter:
# istio.metadata_exchange is the first filter in the connection
# manager, at least in Istio 1.6.14.
name: "istio.metadata_exchange"
patch:
operation: INSERT_BEFORE
value:
name: envoy.filters.http.lua
typed_config:
"@type": type.googleapis.com/envoy.extensions.filters.http.lua.v3.Lua
inline_code: |
function envoy_on_request(request_handle)
local service_host = request_handle:headers():get("service-host")
if service_host ~= nil then
request_handle:headers():replace("host", service_host)
end
end
Finally, the VirtualService
that handles the traffic routing needs to be tied both to the ingress and to the mesh
gateway. The hosts
setting can just be the internal service name, though, since that’s what the ingress will use now.
apiVersion: networking.istio.io/v1beta1
kind: VirtualService
metadata:
name: mysvc
namespace: myns
spec:
gateways:
- istio-system/apigee-mtls
- mesh
hosts:
- mysvc
http:
- route:
- destination:
host: mysvc-stable
weight: 50
- destination:
host: mysvc-baseline
weight: 25
- destination:
host: mysvc-canary
weight: 25
Once all these things are complete, both internal and external traffic will be routed by the single VirtualService
. Now I can control canary load balancing in a single location and be sure that I’m getting correct overall test results and statistics with as few moving pieces as possible.
Disclaimer: There may be reasons you don’t want to treat external traffic the same as internal, like if you have different DestinationRule
settings for traffic management inside vs. outside, or if you need to pass things through different authentication filters or whatever. Everything I’m working with is super locked down so I treat internal and external traffic with the same high levels of distrust and ensure that both types of traffic are scrutinized equally. YMMV.
I recently had an issue where something got out of sync and I couldn’t log into my Mac using my domain account. This is sort of a bunch of tips and things I did to recover that.
First, have a separate local admin account. Make it a super complex password and never use it for anything else. This is sort of your escape hatch to try to recover your regular user account. Even if you want to have a local admin account so your regular user account can stay a user and no admin… have a dedicated “escape hatch” admin account that’s separate from the “I use this sometimes for sudo
purposes” admin account. I have this, and if I hadn’t, that’d have been the end of it.
It’s good to remember for a domain-joined account there are three security tokens that all need to be kept in sync: Your domain user password, your local machine OS password, and your disk encryption token. When you reboot the computer, the first password you’ll be asked for should unlock the disk encryption. Usually the token for disk encryption is tied nicely to the machine account password so you enter the one password and it both unlocks the disk and logs you in. The problem I was running into was those got out of sync. For a domain-joined account, the domain password usually is also tied to these things.
Next, keep your disk encryption recovery code handy. Store it in a password manager or something. If things get out of sync, you can use the recovery code to unlock the disk and then your OS password to log in.
For me, I was able to log in as my separate local admin account but my machine password wasn’t working unless I was connected to the domain. Only way to connect to the domain was over a VPN. That meant I needed to enable fast user switching so I could connect to the VPN under the separate local admin and then switch - without logging out - to my domain account.
Once I got to my own account I could use the Users & groups app to change my domain password and have the domain and machine accounts re-synchronized. ALWAYS ALWAYS ALWAYS USE USERS & GROUPS TO CHANGE YOUR DOMAIN ACCOUNT PASSWORD. I have not found a way otherwise to ensure everything is in sync. Don’t change it from some other workstation, don’t change it from Azure Active Directory. This is the road to ruin. Stay with Users & Groups.
The last step was that my disk encryption token wasn’t in sync - OS and domain connection was good, but I couldn’t log in after a reboot. I found the answer in a Reddit thread:
su local_admin
sysadminctl -secureTokenStatus domain_account_username
sysadminctl -secureTokenOff domain_account_username \
-password domain_account_password \
interactive
sysadminctl -secureTokenOn domain_account_username \
-password domain_account_password \
interactive
Basically, as the standalone local admin, turn off and back on again the connection to the drive encryption. This refreshes the token and gets it back in sync.
Reboot, and you should be able to log in with your domain account again.
To test it out, you may want to try changing your password from Users & Groups to see that the sync works. If you get a “password complexity” error, it could be the sign of an issue… or it could be the sign that your domain has a “you can’t change the password more than once every X days” sort of policy and since you changed it earlier you are changing it again too soon. YMMV.
And, again, always change your password from Users & Groups.
]]>These are my adventures in trying to debug this issue. Some of it is to remind me of what I did. Some of it is to save you some trouble if you run into the issue. Some of it is to help you see what I did so you can apply some of the techniques yourself.
TL;DR: The problem is that Prometheus v2.21.0 disabled HTTP/2 and that needs to be re-enabled for things to work. There should be a Prometheus release soon that allows you to re-enable HTTP/2 with environment variables.
I created a repro repository with a minimal amount of setup to show how things work. It can get you from a bare Kubernetes cluster up to Istio 1.6.14 and Prometheus using the same values I am. You’ll have to supply your own microservice/app to demonstrate scraping, but the prometheus-example-app
may be a start.
I deploy Prometheus using the Helm chart. As part of that, I have an Istio sidecar manually injected just like they do in the official 1.6 Istio release manifests. By doing this, the sidecar will download and share the certificates but it won’t proxy any of the Prometheus traffic.
I then have a Prometheus scrape configuration that uses the certificates mounted in the container. If it finds a pod that has the Istio sidecar annotations (indicating it’s got the sidecar injected), it’ll use the certificates for authentication and communication.
- job_name: "kubernetes-pods-istio-secure"
scheme: https
tls_config:
ca_file: /etc/istio-certs/root-cert.pem
cert_file: /etc/istio-certs/cert-chain.pem
key_file: /etc/istio-certs/key.pem
insecure_skip_verify: true
If I deploy Prometheus v2.20.1, I see that my services are being scraped by the kubernetes-pods-istio-secure
job, they’re using HTTPS, and everything is good to go. Under v2.20.1, I see the error connection reset by peer
. I tried asking about this in the Prometheus newsgroup to no avail, so… I dove in.
My first step was to update the Helm chart extraArgs
to turn on Prometheus debug logging.
extraArgs:
log.level: debug
I was hoping to see more information about what was happening. Unfortunately, I got basically the same thing.
level=debug ts=2021-07-06T20:58:32.984Z caller=scrape.go:1236 component="scrape manager" scrape_pool=kubernetes-pods-istio-secure target=https://10.244.3.10:9102/metrics msg="Scrape failed" err="Get \"https://10.244.3.10:9102/metrics\": read tcp 10.244.4.89:36666->10.244.3.10:9102: read: connection reset by peer"
This got me thinking one of two things may have happened in v2.21.0:
I had recently fought with a dotnet
CLI problem where certain TLS cipher suites were disabled by default and some OS configuration settings on our build agents affected what was seen as allowed vs. not allowed. This was stuck in my mind so I couldn’t immediately rule out the container OS configuration.
To validate the OS issue I was going to try using curl
and/or openssl
to connect to the microservice and see what the cipher suites were. Did I need an Istio upgrade? Was there some configuration setting I was missing? Unfortunately, it turns out the Prometheus Docker image is based on a custom busybox image where there are no package managers or tools. I mean, this is actually a very good thing from a security perspective but it’s a pain for debugging.
What I ended up doing was getting a recent Ubuntu image and connecting using that, just to see. I figured if there was anything obvious going on that I could take the extra steps of creating a custom Prometheus image with curl
and openssl
to investigate further. I mounted a manual sidecar just like I did for Prometheus so I could get to the certificates without proxying traffic, then I ran some commands:
curl https://10.244.3.10:9102/metrics \
--cacert /etc/istio-certs/root-cert.pem \
--cert /etc/istio-certs/cert-chain.pem \
--key /etc/istio-certs/key.pem \
--insecure
openssl s_client \
-connect 10.244.3.10:9102 \
-cert /etc/istio-certs/cert-chain.pem \
-key /etc/istio-certs/key.pem \
-CAfile /etc/istio-certs/root-cert.pem \
-alpn "istio"
Here’s some example output from curl
to show what I was seeing:
root@sleep-5f98748557-s4wh5:/# curl https://10.244.3.10:9102/metrics --cacert /etc/istio-certs/root-cert.pem --cert /etc/istio-certs/cert-chain.pem --key /etc/istio-certs/key.pem --insecure -v
* Trying 10.244.3.10:9102...
* TCP_NODELAY set
* Connected to 10.244.3.10 (10.244.3.10) port 9102 (#0)
* ALPN, offering h2
* ALPN, offering http/1.1
* successfully set certificate verify locations:
* CAfile: /etc/istio-certs/root-cert.pem
CApath: /etc/ssl/certs
* TLSv1.3 (OUT), TLS handshake, Client hello (1):
* TLSv1.3 (IN), TLS handshake, Server hello (2):
* TLSv1.3 (IN), TLS handshake, Encrypted Extensions (8):
* TLSv1.3 (IN), TLS handshake, Request CERT (13):
* TLSv1.3 (IN), TLS handshake, Certificate (11):
* TLSv1.3 (IN), TLS handshake, CERT verify (15):
* TLSv1.3 (IN), TLS handshake, Finished (20):
* TLSv1.3 (OUT), TLS change cipher, Change cipher spec (1):
* TLSv1.3 (OUT), TLS handshake, Certificate (11):
* TLSv1.3 (OUT), TLS handshake, CERT verify (15):
* TLSv1.3 (OUT), TLS handshake, Finished (20):
* SSL connection using TLSv1.3 / TLS_AES_256_GCM_SHA384
* ALPN, server accepted to use h2
* Server certificate:
* subject: [NONE]
* start date: Jul 7 20:21:33 2021 GMT
* expire date: Jul 8 20:21:33 2021 GMT
* issuer: O=cluster.local
* SSL certificate verify ok.
* Using HTTP2, server supports multi-use
* Connection state changed (HTTP/2 confirmed)
* Copying HTTP/2 data in stream buffer to connection buffer after upgrade: len=0
* Using Stream ID: 1 (easy handle 0x564d80d81e10)
> GET /metrics HTTP/2
> Host: 10.244.3.10:9102
> user-agent: curl/7.68.0
> accept: */*
>
* TLSv1.3 (IN), TLS handshake, Newsession Ticket (4):
* old SSL session ID is stale, removing
* Connection state changed (MAX_CONCURRENT_STREAMS == 2147483647)!
< HTTP/2 200
A few things in particular:
--alpn "istio"
thing for openssl
while looking through Istio issues to see if there were any pointers there. It’s always good to read through issues lists to get ideas and see if other folks are running into the same problems.openssl
and curl
were able to connect to the microservice using the certificates from Istio.openssl
output was one that was considered “recommended.” I forgot to capture that output for the blog article, sorry about that.At this point I went to the release notes for Prometheus v2.21.0 to see what had changed. I noticed two things that I thought may affect my situation:
I did see in that curl
output that it was using HTTP/2
but… is it required? Unclear. However, looking at the Go docs about the X.509 CommonName thing, that’s easy enough to test. I just needed to add an environment variable to the Helm chart for Prometheus:
env:
- name: GODEBUG
value: x509ignoreCN=0
After redeploying… it didn’t fix anything. That wasn’t the problem. That left the HTTP/2 thing. However, what I found was it’s hardcoded off, not disabled through some configuration mechanism so there isn’t a way to just turn it back on to test. The only way to test it is to do a fully custom build.
The Prometheus build for a Docker image is really complicated. They have this custom build tool promu
that runs the build in a custom build container and all this is baked into layers of make
and yarn
and such. As it turns out, not all of it happens in the container, either, because if you try to build on a Mac you’ll get an error like this:
... [truncated huge list of downloads] ...
go: downloading github.com/PuerkitoBio/urlesc v0.0.0-20170810143723-de5bf2ad4578
go: downloading github.com/Azure/go-autorest/autorest/validation v0.3.1
go: downloading github.com/Azure/go-autorest/autorest/to v0.4.0
go build github.com/aws/aws-sdk-go/service/ec2: /usr/local/go/pkg/tool/linux_amd64/compile: signal: killed
!! command failed: build -o .build/linux-amd64/prometheus -ldflags -X github.com/prometheus/common/version.Version=2.28.1 -X github.com/prometheus/common/version.Revision=b0944590a1c9a6b35dc5a696869f75f422b107a1 -X github.com/prometheus/common/version.Branch=HEAD -X github.com/prometheus/common/version.BuildUser=root@76a91e410d00 -X github.com/prometheus/common/version.BuildDate=20210709-14:47:03 -extldflags '-static' -a -tags netgo,builtinassets github.com/prometheus/prometheus/cmd/prometheus: exit status 1
make: *** [Makefile.common:227: common-build] Error 1
!! The base builder docker image exited unexpectedly: exit status 2
You can only build on Linux even though it’s happening in a container. At least right now. Maybe that’ll change in the future. Anyway, this meant I needed to create a Linux VM and set up an environment there that could build Prometheus… or figure out how to force a build system to do it, say by creating a fake PR to the Prometheus project. I went the Linux VM route.
I changed the two lines where the HTTP/2 was disabled, I pushed that to a temporary Docker Hub location, and I got it deployed in my cluster.
Success! Once HTTP/2 was re-enabled, Prometheus was able to scrape my Istio pods again.
I worked through this all with the Prometheus team and they were able to replicate the issue using my repro repo. They are now working through how to re-enable HTTP/2 using environment variables or configuration.
All of this took close to a week to get through.
It’s easy to read these blog articles and think the writer just blasted through all this and it was all super easy, that I already knew the steps I was going to take and flew through it. I didn’t. There was a lot of reading issues. There was a lot of trying things and then retrying those same things because I forgot what I’d just tried, or maybe I discovered I forgot to change a configuration value. I totally deleted and re-created my test Kubernetes cluster like five times because I also tried updating Istio and… well, you can’t really “roll back Istio.” It got messy. Not to mention, debugging things at the protocol level is a spectacular combination of “not interesting” and “not my strong suit.”
My point is, don’t give up. Pushing through these things and reading and banging your head on it is how you get the experience so that next time you will have been through it.
]]>I’m a huge fan of Spinnaker, but sometimes you already have a full CI/CD system in place and you really don’t want to replace all of that with Spinnaker. You really just want the canary part of Spinnaker. Luckily, you can totally use Kayenta as a standalone service. They even have some light documentation on it!
In my specific case, I also want to use Azure Storage as the place where I store the data for Kayenta - canary configuration, that sort of thing. It’s totally possible to do that, but, at least at the time of this writing, the hal config canary
Halyard command does not have Azure listed and the docs don’t cover it.
So there are a couple of things that come together here, and maybe all of it’s interesting to you or maybe only one piece. In any case, here’s what we’re going to build:
Things I’m not going to cover:
This stuff is hard and it gets pretty deep pretty quickly. I can’t cover it all in one go. I don’t honestly have answers to all of it anyway, since a lot of it depends on how your build pipeline is set up, how your app is set up, and what your app does. There’s no “one-size-fits-all.”
Let’s do it.
First, provision an Azure Storage account. Make sure you enable HTTP access because right now Kayenta requires HTTP and not HTTPS.
You also need to provision a container in the Azure Storage account to hold the Kayenta contents.
# I love me some PowerShell, so examples/scripts will be PowerShell.
# Swap in your preferred names as needed.
$ResourceGroup = "myresourcegroup"
$StorageAccountName = "kayentastorage"
$StorageContainerName = "kayenta"
$Location = "westus2"
# Create the storage account with HTTP enabled.
az storage account create `
--name $StorageAccountName `
--resoure-group $ResourceGroup `
--location $Location `
--https-only false `
--sku Standard_GRS
# Get the storage key so you can create a container.
$StorageKey = az storage account keys list `
--account-name $StorageAccountName `
--query '[0].value' `
-o tsv
# Create the container that will hold Kayenta stuff.
az storage container create `
--name $StorageContainerName `
--account-name $StorageAccountName `
--account-key $StorageKey
Let’s make a namespace in Kubernetes for Kayenta so we can put everything we’re deploying in there.
# We'll use the namespace a lot, so a variable
# for that in our scripting will help.
$Namespace = "kayenta"
kubectl create namespace $Namespace
Kayenta needs Redis. We can use the Helm chart to deploy a simple Redis instance. Redis must not be in clustered mode, and there’s no option for providing credentials.
helm repo add bitnami https://charts.bitnami.com/bitnami
# The name of the deployment will dictate the name of the
# Redis master service that gets deployed. In this example,
# 'kayenta-redis' as the deployment name will create a
# 'kayenta-redis-master' service. We'll need that later for
# Kayenta configuration.
helm install kayenta-redis bitnami/redis `
-n $Namespace `
--set cluster.enabled=false `
--set usePassword=false `
--set master.persistence.enabled=false
Now let’s get Kayenta configured. This is a full, commented version of a Kayenta configuration file. There’s also a little doc on Kayenta configuration that might help. What we’re going to do here is put the kayenta.yml
configuration into a Kubernetes ConfigMap so it can be used in our service.
Here’s a ConfigMap YAML file based on the fully commented version, but with the extra stuff taken out. This is also where you’ll configure the location of Prometheus (or whatever) where Kayenta will read stats. For this example, I’m using Prometheus with some basic placeholder config.
apiVersion: v1
kind: ConfigMap
metadata:
name: kayenta
namespace: kayenta
data:
kayenta.yml: |-
server:
port: 8090
# This should match the name of the master service from when
# you deployed the Redis Helm chart earlier.
redis:
connection: redis://kayenta-redis-master:6379
kayenta:
atlas:
enabled: false
google:
enabled: false
# This is the big one! Here's where you configure your Azure Storage
# account and container details.
azure:
enabled: true
accounts:
- name: canary-storage
storageAccountName: kayentastorage
# azure.storageKey is provided via environment AZURE_STORAGEKEY
# so it can be stored in a secret. You'll see that in a bit.
# Don't check in credentials!
accountAccessKey: ${azure.storageKey}
container: kayenta
rootFolder: kayenta
endpointSuffix: core.windows.net
supportedTypes:
- OBJECT_STORE
- CONFIGURATION_STORE
aws:
enabled: false
datadog:
enabled: false
graphite:
enabled: false
newrelic:
enabled: false
# Configure your Prometheus here. Or if you're using something else, disable
# Prometheus and configure your own metrics store. The important part is you
# MUST have a metrics store configured!
prometheus:
enabled: true
accounts:
- name: canary-prometheus
endpoint:
baseUrl: http://prometheus:9090
supportedTypes:
- METRICS_STORE
signalfx:
enabled: true
wavefront:
enabled: false
gcs:
enabled: false
blobs:
enabled: true
s3:
enabled: false
stackdriver:
enabled: false
memory:
enabled: false
configbin:
enabled: false
remoteJudge:
enabled: false
# Enable the SCAPE endpoint that has the same user experience that the Canary StageExecution in Deck/Orca has.
# By default this is disabled - in standalone we enable it!
standaloneCanaryAnalysis:
enabled: true
metrics:
retry:
series: SERVER_ERROR
statuses: REQUEST_TIMEOUT, TOO_MANY_REQUESTS
attempts: 10
backoffPeriodMultiplierMs: 1000
serialization:
writeDatesAsTimestamps: false
writeDurationsAsTimestamps: false
management.endpoints.web.exposure.include: '*'
management.endpoint.health.show-details: always
keiko:
queue:
redis:
queueName: kayenta.keiko.queue
deadLetterQueueName: kayenta.keiko.queue.deadLetters
spectator:
applicationName: ${spring.application.name}
webEndpoint:
enabled: true
swagger:
enabled: true
title: Kayenta API
description:
contact:
patterns:
- /admin.*
- /canary.*
- /canaryConfig.*
- /canaryJudgeResult.*
- /credentials.*
- /fetch.*
- /health
- /judges.*
- /metadata.*
- /metricSetList.*
- /metricSetPairList.*
- /metricServices.*
- /pipeline.*
- /standalone.*
Save that and deploy it to the cluster.
kubectl apply -f kayenta-configmap.yml
You’ll notice in the config we just put down that we did not include the Azure Storage acccount key. Assuming we want to commit that YAML to a source control system at some point, we definitely don’t want credentials in there. Instead, let’s use a Kubernetes secret for the Azure Storage account key.
# Remember earlier we got the storage account key for creating
# the container? We're going to use that again.
kubectl create secret generic azure-storage `
-n $Namespace `
--from-literal=storage-key="$StorageKey"
It’s deployment time! Let’s get a Kayenta container into the cluster! Obviously you can tweak all the tolerances and affinities and node selectors and all that to your heart’s content. I’m keeping the example simple.
apiVersion: apps/v1
kind: Deployment
metadata:
name: kayenta
namespace: kayenta
labels:
app.kubernetes.io/name: kayenta
spec:
replicas: 1
selector:
matchLabels:
app.kubernetes.io/name: kayenta
template:
metadata:
labels:
app.kubernetes.io/name: kayenta
spec:
containers:
- name: kayenta
# Find the list of tags here: https://console.cloud.google.com/gcr/images/spinnaker-marketplace/GLOBAL/kayenta?gcrImageListsize=30
# This is just the tag I've been using for a while. I use one of the images NOT tagged
# with Spinnaker because the Spinnaker releases are far slower.
image: "gcr.io/spinnaker-marketplace/kayenta:0.17.0-20200803200017"
env:
# If you need to troubleshoot, you can set the logging level by adding
# -Dlogging.level.root=TRACE
# Without the log at DEBUG level, very little logging comes out at all and
# it's really hard to see if something goes wrong. If you don't want that
# much logging, go ahead and remove the log level option here.
- name: JAVA_OPTS
value: "-XX:+UnlockExperimentalVMOptions -Dlogging.level.root=DEBUG"
# We can store secrets outside config and provide them via the environment.
# Insert them into the config file using ${dot.delimited} versions of the
# variables, like ${azure.storageKey} which we saw in the ConfigMap.
- name: AZURE_STORAGEKEY
valueFrom:
secretKeyRef:
name: azure-storage
key: storage-key
ports:
- name: http
containerPort: 8090
protocol: TCP
livenessProbe:
httpGet:
path: /health
port: http
readinessProbe:
httpGet:
path: /health
port: http
volumeMounts:
- name: config-volume
mountPath: /opt/kayenta/config
volumes:
- name: config-volume
configMap:
name: kayenta
And let’s save and apply.
kubectl apply -f kayenta-deployment.yml
If you have everything wired up right, the Kayenta instance should start. But we want to see something happen, right? Without kubectl port-forward
?
Let’s put a LoadBalancer service in here so we can access it. I’m going to show the simplest Kubernetes LoadBalancer here, but in your situation you might have, say, an nginx ingress in play or something else. You’ll have to adjust as needed.
apiVersion: v1
kind: Service
metadata:
name: kayenta
namespace: kayenta
labels:
app.kubernetes.io/name: kayenta
spec:
ports:
- port: 80
targetPort: http
protocol: TCP
name: http
selector:
app.kubernetes.io/name: kayenta
type: LoadBalancer
Let’s see it do something. You should be able to get the public IP address for that LoadBalancer service by doing:
kubectl get service/kayenta -n $Namespace
You’ll see something like this:
NAME TYPE CLUSTER-IP EXTERNAL-IP PORT(S) AGE
kayenta LoadBalancer 10.3.245.137 104.198.205.71 80/TCP 54s
Take note of that external IP and you can visit the Swagger docs in a browser: http://104.198.205.71/swagger-ui.html
If it’s all wired up, you should get some Swagger docs!
The first operation you should try is under credentials-controller
- GET /credentials
. This will tell you what metrics and object stores Kayenta thinks it’s talking to. The result should look something like this:
[
{
"name": "canary-prometheus",
"supportedTypes": [
"METRICS_STORE"
],
"endpoint": {
"baseUrl": "http://prometheus"
},
"type": "prometheus",
"locations": [],
"recommendedLocations": []
},
{
"name": "canary-storage",
"supportedTypes": [
"OBJECT_STORE",
"CONFIGURATION_STORE"
],
"rootFolder": "kayenta",
"type": "azure",
"locations": [],
"recommendedLocations": []
}
]
If you are missing the canary-storage
account pointing to azure
- that means Kayenta can’t access the storage account or it’s otherwise misconfigured. I found the biggest gotcha here was that it’s HTTP-only and that’s not the default for a storage account if you create it through the Azure portal. You have to turn that on.
What do you do if you can’t figure out why Kayenta isn’t connecting to stuff?
Up in the Kubernetes deployment, you’ll see the logging is set up at the DEBUG
level. The logging is pretty good at this level. You can use kubectl logs
to get the logs from the Kayenta pods or, better, use stern
for that Those logs are going to be your secret. You’ll see errors that pretty clearly indicate whether there’s a DNS problem or a bad password or something similar.
If you still aren’t getting enough info, turn the log level up to TRACE
. It can get noisy, but you’ll only need it for troubleshooting.
There’s a lot you can do from here.
Canary configuration: Actually configuring a canary is hard. For me, it took deploying a full Spinnaker instance and doing some canary stuff to figure it out. There’s a bit more doc on it now, but it’s definitely tricky. Here’s a pretty basic configuration where we just look for errors by ASP.NET microservice controller. No, I can not help or support you in configuring a canary. I’ll give you this example with no warranties, expressed or implied.
{
"canaryConfig": {
"applications": [
"app"
],
"classifier": {
"groupWeights": {
"StatusCodes": 100
},
"scoreThresholds": {
"marginal": 75,
"pass": 75
}
},
"configVersion": "1",
"description": "App Canary Configuration",
"judge": {
"judgeConfigurations": {
},
"name": "NetflixACAJudge-v1.0"
},
"metrics": [
{
"analysisConfigurations": {
"canary": {
"direction": "increase",
"nanStrategy": "replace"
}
},
"groups": [
"StatusCodes"
],
"name": "Errors By Controller",
"query": {
"customInlineTemplate": "PromQL:sum(increase(http_requests_received_total{app='my-app',azure_pipelines_version='${location}',code=~'5\\\\d\\\\d|4\\\\d\\\\d'}[120m])) by (action)",
"scopeName": "default",
"serviceType": "prometheus",
"type": "prometheus"
},
"scopeName": "default"
}
],
"name": "app-config",
"templates": {
}
},
"executionRequest": {
"scopes": {
"default": {
"controlScope": {
"end": "2020-11-20T23:01:09.3NZ",
"location": "baseline",
"scope": "control",
"start": "2020-11-20T21:01:09.3NZ",
"step": 2
},
"experimentScope": {
"end": "2020-11-20T23:01:09.3NZ",
"location": "canary",
"scope": "experiment",
"start": "2020-11-20T21:01:09.3NZ",
"step": 2
}
}
},
"siteLocal": {
},
"thresholds": {
"marginal": 75,
"pass": 95
}
}
}
Integrate with your CI/CD pipeline: Your deployment is going to need to know how to track the currently deployed vs. new/canary deployment. Statistics are going to need to be tracked that way, too. (That’s the same as if you were using Spinnaker.) I’ve been using the KubernetesManifest@0
task in Azure DevOps, setting trafficSplitMethod: smi
and making use of the canary control there. A shell script polls Kayenta to see how the analysis is going.
How you do this for your template is very subjective. Pipelines at this level are really complex. I’d recommend working with Postman or some other HTTP debugging tool to get things working before trying to automate it.
Secure it!: You probably don’t want public anonymous access to the Kayenta API. I locked mine down with oauth2-proxy and Istio but you could do it with nginx ingress and oauth2-proxy or some other mechanism.
Put a UI on it!: As you can see, configuring Kayenta canaries without a UI is actually pretty hard. Nike has a UI for standalone Kayenta called “Referee”. At the time of this writing there’s no Docker container for it so it’s not as easy to deploy as you might like. However, there is a Dockerfile gist that might be helpful. I have not personally got this working, but it’s on my list of things to do.
Huge props to my buddy Chris who figured a lot of this out, especially the canary configuration and Azure DevOps integration pieces.
]]>My daughter Phoenix, who is now nine, is obsessed with Hamilton. I think she listens to it at least once daily. Given that, she insisted that we do Hamilton costumes. I was to be A. Ham, Jenn as Eliza, and Phoenix as their daughter also named Eliza.
I was able to put Phoe’s costume together in two or three days. We used a pretty standard McCall’s pattern with decent instructions and not much complexity.
For mine… I had to do some pretty custom work. I started with these patterns:
It took me a couple of months to get things right. They didn’t really have 6’2” fat guys in the Revolutionary War so there was a lot of adjustment, especially to the coat, to get things to fit. I made muslin versions of everything probably twice, maybe three times for the coat to get the fit right.
I had a really challenging time figuring out how the shoulders on the coat went together. The instructions on the pattern are fairly vague and not what I’m used to with more commercial patterns. This tutorial article makes a similar coat and helped a lot in figuring out how things worked. It’s worth checking out.
Modifications I had to make:
I didn’t have to modify the shirt. The shirt is already intentionally big and baggy because that’s how shirts were back then, so there was a lot of play.
The pants were more like… I didn’t have a decent pattern that actually looked like Revolutionary War pants so I took some decent costume pants and just modded them up. They didn’t have button fly pants back then and my pants have that, but I also wasn’t interested in drop-front pants or whatever other pants I’d have ended up with. I do need to get around in these things.
I didn’t keep a cost tally this time and it’s probably good I didn’t. There are well over 50 buttons on this thing and buttons are not cheap. I bought good wool for the whole thing at like $25/yard (average) and there are a good six-to-eight yards in here. I went through a whole bolt of 60” muslin betwee my costume and the rest of our costumes. I can’t possibly have come out under $300.
But they turned out great!
Here’s my costume close up on a dress form:
And the costume in action:
Here’s the whole family! I think they turned out nicely.
Work! Work!
]]>I need to create container registries that have customer managed key support enabled. Unfortunately, there are a lot of steps to this and there are some things that aren’t obvious, like:
Normally I’d think about doing this with something like Terraform but as of this writing, Terraform doesn’t have support for ACR + CMK so… script it is.
This is more a “pruning” operation than deleting, but “prune” isn’t an approved PowerShell verb and I do love me some PowerShell.
In a CI/CD environment, generally you want to keep:
…and, actually, that’s about it. CI/CD is fail-forward, so there’s not really a roll-back-three-versions case. You’d roll back the code and build a new container.
Point being, there’s not really a retention policy that handles this in ACR right now. While this script also doesn’t totally handle it the way I’d like, what it can do is keep the most recent X tags of an image and prune all the old ones. I also added a way to regex match a container repository by name so you can be more precise about targeting what you want to prune.
This is sort of a bulk copy operation for ACR. For reasons I won’t get into, I needed to copy all the images off an ACR, delete/re-create the ACR, and copy them all back. While the az
CLI supports importing one image/tag at a time, there’s not really a bulk copy. There’s a ‘transfer artifacts’ mechanism but it’s sort of complex to set up and the az
CLI is already here, so…
This script gets all the repositories and all the tags from each repository and does az acr import
on all of them. It’s not fast, but it gets the job done.
I’ve set this up in the past without too much challenge using nginx ingress but I don’t want Istio bypassed here. Unfortunately, setting up oauth2-proxy with an Istio (Envoy) ingress is a lot more complex than sticking a couple of annotations in there.
Luckily, I found this blog article by Justin Gauthier who’d done a lot of the leg-work to figure things out. The difference in that blog article and what I want done are:
With all that in mind, let’s get going.
There are some things you need to set up before you can get this going.
Pick a subdomain on which you’ll have the service and the oauth2-proxy. For our purposes, let’s pick cluster.example.com
as the subdomain. You want a single subdomain so you can share cookies and so it’s easier to set up DNS and certificates.
We’ll put the app and oauth2-proxy under that.
myapp.cluster.example.com
.oauth.cluster.example.com
.In your DNS system you need to assign the wildcard DNS *.cluster.example.com
to the IP address that your Istio ingress is using. If someone visits https://myapp.cluster.example.com
they should be able to get to your service in the cluster via the Istio ingress gateway.
For an application to allow OpenID Connect / OAuth through Azure AD, you need to register the application with Azure AD. The application should be for the service you’re securing.
In that application you need to:
APPLICATION-ID-GUID
.TENANT-ID-GUID
/oauth2/callback
relative to your app, like https://myapp.cluster.example.com/oauth2/callback
.user_impersonation
but you could call yours fluffy
and it wouldn’t matter. The scope URI will end up looking like api://APPLICATION-ID-GUID/user_impersonation
where that GUID is the ID for your application.user_impersonation
scope you just created.Microsoft.Graph - User.Read
so oauth2-proxy can validate credentials.myapp-client-secret
but yours is going to be a long string of random characters.Finally, somewhat related - take note of the email domain associated with your users in Azure Active Directory. For our example, we’ll say everyone has an @example.com
email address. We’ll use that when configuring oauth2-proxy for who can log in.
Set up cert-manager in the cluster. I found the DNS01 solver worked best for me with Istio in the mix because it was easy to get Azure DNS hooked up.
The example here assumes that you have it set up so you can drop a Certificate
into a Kubernetes namespace and cert-manager will take over, request a certificate, and populate the appropriate Kubernetes secret that can be used by the Istio ingress gateway for TLS.
Setting up cert-manager isn’t hard, but there’s already a lot of documentation on it so I’m not going to repeat all of it.
If you can’t use cert-manager in your environment then you’ll have to adjust for that when you see the steps where the TLS bits are getting set up later.
OK, you have the prerequisites set up, let’s get to it.
If you have traffic going through an egress in Istio, you will need to set up a ServiceEntry
to allow access to the various Azure AD endpoints from oauth2-proxy. I have all outbound traffic requiring egress so this was something I had to do.
apiVersion: networking.istio.io/v1beta1
kind: ServiceEntry
metadata:
name: azure-istio-egress
namespace: istio-system
spec:
hosts:
- '*.microsoft.com'
- '*.microsoftonline.com'
- '*.windows.net'
location: MESH_EXTERNAL
ports:
- name: https
number: 443
protocol: HTTPS
resolution: NONE
I use a lot of other Azure services, so I have some pretty permissive outbound allowances. You can try to reduce this to just the minimum of what you need by doing a little trial and error. I know I ran into:
graph.windows.com
- Azure AD graph APIlogin.windows.net
- Common JWKS endpointsts.windows.net
- Token issuer, also used for token validation*.microsoftonline.com
, *.microsoft.com
- Some UI redirection happens to allow OIDC login here with a Microsoft accountI’ll admit after I got through a bunch of different minor things, I just started whitelisting egress allowances. It wasn’t that important for me to be exact for this.
I did deploy this to the istio-system
namespace. It seems that it doesn’t matter where a ServiceEntry
gets deployed, once it’s out there it works for any service in the cluster. I ended up just deploying all of these to the istio-system
namespace so it’s easier to track.
OpenID Connect via Azure AD requires a TLS connection for your app. cert-manager takes care of converting a Certificate
object to a Kubernetes Secret
for us.
It’s important to note that we’re going to use the standard istio-ingressgateway
to handle our inbound traffic, and that’s in the istio-system
namespace. You can’t read Kubernetes secrets across namespaces, so the Certificate
needs to be deployed to the istio-system
namespace.
This is one of the places where you’ll see why it’s good to have picked a common subdomain for the oauth2-proxy and the app - wildcard certificate.
apiVersion: cert-manager.io/v1beta1
kind: Certificate
metadata:
name: tls-myapp-production
namespace: istio-system
spec:
commonName: '*.cluster.example.com'
dnsNames:
- '*.cluster.example.com'
issuerRef:
kind: ClusterIssuer
name: letsencrypt-production
secretName: tls-myapp-production
Create your application namespace and enable Istio sidecar injection. This is where your app/service, oauth2-proxy, and Redis will go.
kubectl create namespace myapp
kubectl label namespace myapp istio-injection=enabled
You need to enable Redis as a session store for oauth2-proxy if you want the Istio token validation in place. I gather this isn’t required if you don’t want Istio doing any token validation, but I did, so here we go.
I used the Helm chart v10.5.7 for Redis. There are… a lot of ways you can set up Redis. I set up the demo version here in a very simple, non-clustered manner. Depending on how you set up Redis, you may need to adjust your oauth2-proxy configuration.
Here’s the values.yaml
I used for deploying Redis:
cluster:
enabled: false
usePassword: true
password: "my-redis-password"
master:
persistence:
enabled: false
When you deploy your application, you’ll need to set up:
Deployment
and Service
VirtualService
and Gateway
The Deployment
doesn’t have anything special, it just exposes a port that can be routed to by a Service
. Here’s a simple Deployment
.
apiVersion: apps/v1
kind: Deployment
metadata:
name: myapp
namespace: myapp
labels:
app.kubernetes.io/name: myapp
spec:
replicas: 1
selector:
matchLabels:
app.kubernetes.io/name: myapp
template:
metadata:
labels:
app.kubernetes.io/name: myapp
spec:
containers:
- image: "docker.io/path/to/myapp:sometag"
imagePullPolicy: IfNotPresent
name: myapp
ports:
- containerPort: 80
name: http
protocol: TCP
We have a Kubernetes Service
for that Deployment
:
apiVersion: v1
kind: Service
metadata:
name: myapp
namespace: myapp
labels:
app.kubernetes.io/name: myapp
spec:
ports:
# Exposes container port 80 on service port 8000.
# This is pretty arbitrary, but you need to know
# the Service port for the VirtualService later.
- name: http
port: 8000
protocol: TCP
targetPort: http
selector:
app.kubernetes.io/name: myapp
The Istio VirtualService
is another layer on top of the Service
that helps in traffic control. Here’s where we start tying the ingress gateway to the Service
.
apiVersion: networking.istio.io/v1beta1
kind: VirtualService
metadata:
labels:
app.kubernetes.io/name: myapp
name: myapp
namespace: myapp
spec:
gateways:
# Name of the Gateway we're going to deploy in a minute.
- myapp
hosts:
# The full host name of the app.
- myapp.cluster.example.com
http:
- route:
- destination:
# This is the Kubernetes Service info we just deployed.
host: myapp
port:
number: 8000
Finally, we have an Istio Gateway
that ties the ingress to our VirtualService
.
apiVersion: networking.istio.io/v1beta1
kind: Gateway
metadata:
labels:
app.kubernetes.io/name: myapp
name: myapp
namespace: myapp
spec:
selector:
istio: ingressgateway
servers:
- hosts:
# Same host as the one in the VirtualService, the full
# name for the service.
- myapp.cluster.example.com
port:
# The name here must be unique across all of the ports named
# in the Istio ingress. It doesn't matter what it is as long
# as it's unique. I like using a modified version of the
# host name.
name: https-myapp-cluster-example-com
number: 443
protocol: HTTPS
tls:
# This is the name of the secret that cert-manager placed
# in the istio-system namespace. It should match the
# secretName in the Certificate.
credentialName: tls-myapp-production
mode: SIMPLE
At this point, if you have everything set up right, you should be able to hit https://myapp.cluster.example.com
and get to it anonymously. There’s no oauth2-proxy in place, but the ingress is all wired up to use TLS with that wildcard certificate cert-manager got you and the DNS was set up, too.
If you can’t get to the service, one of the things isn’t lining up:
istio-system
namespace - it must be in istio-system
for the ingress to find it.Gateway
isn’t lining up - credentialName
is wrong, host name is wrong, port name isn’t unique.VirtualService
isn’t lining up - host name is wrong, Gateway
name doesn’t match, Service
name or port is wrong.Service
isn’t lining up - the selector
doesn’t select any pods, the destination port on the pods is wrong.If it feels like you’re Odysseus trying to shoot an arrow through 12 axes, yeah, it’s a lot like that. This isn’t even all the axes.
For this I used the Helm chart v3.2.2 for oauth2-proxy. I created the cookie secret for it like this:
docker run -ti --rm python:3-alpine python -c 'import secrets,base64; print(base64.b64encode(secrets.token_bytes(16)));'
You’re also going to need the client ID from your Azure AD application as well as the client secret. You should have grabbed those during the prerequisites earlier.
The values:
config:
# The client ID of your AAD application.
clientID: "APPLICATION-ID-GUID"
# The client secret you generated for the AAD application.
clientSecret: "myapp-client-secret"
# The cookie secret you just generated with the Python container.
cookieSecret: "the-big-base64-thing-you-made"
# Here's where the interesting stuff happens:
configFile: |-
auth_logging = true
azure_tenant = "TENANT-ID-GUID"
cookie_httponly = true
cookie_refresh = "1h"
cookie_secure = true
email_domains = "example.com"
oidc_issuer_url = "https://sts.windows.net/TENANT-ID-GUID/"
pass_access_token = true
pass_authorization_header = true
provider = "azure"
redis_connection_url = "redis://redis-master.myapp.svc.cluster.local:6379"
redis_password = "my-redis-password"
request_logging = true
session_store_type = "redis"
set_authorization_header = true
silence_ping_logging = true
skip_provider_button = true
skip_auth_strip_headers = false
skip_jwt_bearer_tokens = true
standard_logging = true
upstreams = [ "static://" ]
Important things to note in the configuration file here:
silence_ping_logging
or auth_logging
are totally up to you. These don’t matter to the functionality but make it easier to troubleshoot.redis_connection_url
is going to depend on how you deployed Redis. You want to connect to the Kubernetes Service
that points to the master
, at least in this demo setup. There are a lot of Redis config options for oauth2-proxy that you can tweak. Also, storing passwords in config like this isn’t secure so, like, do something better. But it’s also a lot more to explain how to set up and mount secrets and all that here, so just pretend we did the right thing.pass_access_token
, pass_authorization_header
, set_authorization_header
, and skip_jwt_bearer_tokens
values are super key here. The first three must be set that way for OIDC or OAuth to work; the last one must be set for client_credentials to work.Note on client_credentials: If you want to use client_credentials
with your app, you need to set up an authenticated emails file in oauth2-proxy. In that emails file, you need to include the service principal ID for the application that’s authenticating. Azure AD issues a token for applications with that service principal ID as the subject, and there’s no email.
The service principal ID can be retrieved if you have your application ID:
az ad sp show --id APPLICATION-ID-GUID --query objectId --out tsv
You’ll also need your app to request a scope when you submit a client_credentials
request - use api://APPLICATION-ID-GUID/.default
as the scope. (That .default
scope won’t exist unless you have some scope defined, which is why you defined one earlier.)
Getting back to it… Once oauth2-proxy is set up, you need to add the Istio wrappers on it.
First, let’s add that VirtualService
…
apiVersion: networking.istio.io/v1beta1
kind: VirtualService
metadata:
labels:
app.kubernetes.io/name: oauth2-proxy
name: oauth2-proxy
namespace: myapp
spec:
gateways:
# We'll deploy this gateway in a moment.
- oauth2-proxy
hosts:
# Full host name of the oauth2-proxy.
- oauth.cluster.example.com
http:
- route:
- destination:
# This should line up with the Service that the
# oauth2-proxy Helm chart deployed.
host: oauth2-proxy
port:
number: 80
Now the Gateway
…
apiVersion: networking.istio.io/v1beta1
kind: Gateway
metadata:
labels:
app.kubernetes.io/name: oauth2-proxy
name: oauth2-proxy
namespace: myapp
spec:
selector:
istio: ingressgateway
servers:
- hosts:
# Same host as the one in the VirtualService, the full
# name for oauth2-proxy.
- oauth.cluster.example.com
port:
# Again, this must be unique across all ports named in
# the Istio ingress.
name: https-oauth-cluster-example-com
number: 443
protocol: HTTPS
tls:
# Same secret as the application - it's a wildcard cert!
credentialName: tls-myapp-production
mode: SIMPLE
OK, now you should be able to get something if you hit https://oauth.cluster.example.com
. You’re not passing through it for authentication yet you will likely see something along the lines of an error saying “The reply URL specified in the request does not match the reply URLs configured for the application.” The point is, it shouldn’t be some arbitrary 500 or 404. oauth2-proxy should kick in.
We want Istio to do some token validation in front of our application, so we can deploy a RequestAuthentication
object.
apiVersion: security.istio.io/v1beta1
kind: RequestAuthentication
metadata:
labels:
app.kubernetes.io/name: myapp
name: myapp
namespace: myapp
spec:
jwtRules:
- issuer: https://sts.windows.net/TENANT-ID-GUID/
jwksUri: https://login.windows.net/common/discovery/keys
selector:
matchLabels:
# Match labels should not select the oauth2-proxy, just
# the application being secured.
app.kubernetes.io/name: myapp
The real magic is this last step, an Istio EnvoyFilter
to pass authentication requests for your app through oauth2-proxy. This is the biggest takeaway I got from Justin’s blog article and it’s really the key to the whole thing.
Envoy filter format is in flux. The object defined here is really dependent on the version of Envoy that Istio is using. This was a huge pain. I ended up finding the docs for the Envoy ExtAuthz filter and feeling my way through the exercise, but you should be aware these things do change.
Here’s the Envoy filter:
apiVersion: networking.istio.io/v1alpha3
kind: EnvoyFilter
metadata:
labels:
app.kubernetes.io/name: myapp
name: myapp
namespace: istio-system
spec:
configPatches:
- applyTo: HTTP_FILTER
match:
context: GATEWAY
listener:
filterChain:
filter:
name: envoy.http_connection_manager
subFilter:
# In Istio 1.6.4 this is the first filter. The examples showing insertion
# after some other authorization filter or not showing where to insert
# the filter at all didn't work for me. Istio just failed to insert the
# filter (silently) and moved on.
name: istio.metadata_exchange
# The filter should catch traffic to the service/application.
sni: myapp.cluster.example.com
patch:
operation: INSERT_AFTER
value:
name: envoy.filters.http.ext_authz
typed_config:
'@type': type.googleapis.com/envoy.extensions.filters.http.ext_authz.v3.ExtAuthz
http_service:
authorizationRequest:
allowedHeaders:
patterns:
- exact: accept
- exact: authorization
- exact: cookie
- exact: from
- exact: proxy-authorization
- exact: user-agent
- exact: x-forwarded-access-token
- exact: x-forwarded-email
- exact: x-forwarded-for
- exact: x-forwarded-host
- exact: x-forwarded-proto
- exact: x-forwarded-user
- prefix: x-auth-request
- prefix: x-forwarded
authorizationResponse:
allowedClientHeaders:
patterns:
- exact: authorization
- exact: location
- exact: proxy-authenticate
- exact: set-cookie
- exact: www-authenticate
- prefix: x-auth-request
- prefix: x-forwarded
allowedUpstreamHeaders:
patterns:
- exact: authorization
- exact: location
- exact: proxy-authenticate
- exact: set-cookie
- exact: www-authenticate
- prefix: x-auth-request
- prefix: x-forwarded
server_uri:
# URIs here should be to the oauth2-proxy service inside your
# cluster, in the namespace where it was deployed. The port
# in that 'cluster' line should also match up.
cluster: outbound|80||oauth2-proxy.myapp.svc.cluster.local
timeout: 1.5s
uri: http://oauth2-proxy.myapp.svc.cluster.local
That’s it, you should be good to go!
Note I didn’t really mess around with trying to lock the headers down too much. This is the set I found from the blog article by Justin Gauthier and every time I tried to tweak too much, something would stop working in subtle ways.
With all of this in place, you should be able to hit https://myapp.cluster.example.com
and the Envoy filter will redirect you through oauth2-proxy to Azure Active Directory. Signing in should get you redirected back to your application, this time authenticated.
There are a lot of great tips about troubleshooting and diving into Envoy on the Istio site. This forum post is also pretty good.
Here are a couple of spot tips that I found to be of particular interest.
As noted in the EnvoyFilter
section, filter formats change based on the version of Envoy that Istio is using. You can find out what version of Envoy you’re running in your Istio cluster by using:
$podname = kubectl get pod -l app=prometheus -n istio-system -o jsonpath='{$.items[0].metadata.name}'
kubectl exec -it $podname -c istio-proxy -n istio-system -- pilot-agent request GET server_info
You’ll get a lot of JSON explaining info about the Envoy sidecar, but the important bit is:
{
"version": "80ad06b26b3f97606143871e16268eb036ca7dcd/1.14.3-dev/Clean/RELEASE/BoringSSL"
}
In this case, it’s 1.14.3
.
It’s hard to figure out where the Envoy configuration gets hooked up. The istioctl proxy-status
command can help you.
istioctl proxy-status
will yield a list like this:
NAME CDS LDS EDS RDS PILOT VERSION
myapp-768b999cb5-v649q.myapp SYNCED SYNCED SYNCED SYNCED istiod-5cf5bd4577-frngc 1.6.4
istio-egressgateway-85b568659f-x7cwb.istio-system SYNCED SYNCED SYNCED NOT SENT istiod-5cf5bd4577-frngc 1.6.4
istio-ingressgateway-85c67886c6-stdsf.istio-system SYNCED SYNCED SYNCED SYNCED istiod-5cf5bd4577-frngc 1.6.4
oauth2-proxy-5655cc447d-5ftbq.myapp SYNCED SYNCED SYNCED SYNCED istiod-5cf5bd4577-frngc 1.6.4
redis-5f7c5b99db-tp5l7.myapp SYNCED SYNCED SYNCED SYNCED istiod-5cf5bd4577-frngc 1.6.4
Once you’ve deployed, you’ll see a myapp
listener as well as the Istio ingress. You can dump their config by doing something like
istioctl proxy-config listeners myapp-768b999cb5-v649q.myapp -o json
Sub in the name of the listener as needed. It will generate a huge raft of JSON, so you might need to dump it to a file so you can scroll around in it and find what you want.
When all else fails, restart the ingress pod. kubectl rollout restart deploy/istio-ingressgateway -n istio-system
can get you pretty far. When it seems like everything should be working but you’re getting errors like “network connection reset” and it doesn’t make sense… just try kicking the ingress pods. Sometimes the configuration needs to be freshly rebuilt and deployed and that’s how you do it.
I don’t know why this happens, but if you’ve deployed and undeployed some Envoy filters a couple of times… sometimes something just stops working. Restarting the ingress is the only way I’ve found to fix it… but it works!
oauth2-proxy isn’t the only way to get this done.
I did see this authservice
plugin, which appears to be an Envoy extension to provide oauth2-proxy services right in Envoy itself. Unfortunately, it doesn’t support the latest Istio versions; it requires you manually replace the Istio sidecar with this custom version; and it doesn’t seem to support client_credentials
, which is a primary use case for me.
There’s an OAuth2 filter for Envoy currently in active development (alpha) but I didn’t see that it supported OIDC. I could be wrong there. I’d love to see someone get this working inside Istio.
For older Istio there was an App Identity and Access Adapter but Mixer adapters/plugins have been deprecated in favor of WASM extensions for Envoy.
Are there others? Let me know in the comments!
]]>