<?xml version="1.0" encoding="utf-8"?>
<feed xmlns="http://www.w3.org/2005/Atom">

  <title><![CDATA[The Distinctionl Blog]]></title>
  <link href="http://blog.distinctionl.com/atom.xml" rel="self"/>
  <link href="http://blog.distinctionl.com/"/>
  <updated>2015-01-13T10:19:52+00:00</updated>
  <id>http://blog.distinctionl.com/</id>
  <author>
    <name><![CDATA[Oliver Woodford]]></name>
    
  </author>
  <generator uri="http://octopress.org/">Octopress</generator>

  
  <entry>
    <title type="html"><![CDATA[Perceptually homogenous colourmaps]]></title>
    <link href="http://blog.distinctionl.com/blog/2015/01/08/perceptually-homogenous-colourmaps/"/>
    <updated>2015-01-08T11:51:19+00:00</updated>
    <id>http://blog.distinctionl.com/blog/2015/01/08/perceptually-homogenous-colourmaps</id>
    <content type="html"><![CDATA[<p>A colourmap is a function which maps intensity values to RGB colours. They can be used to create <a href="http://en.wikipedia.org/wiki/False_color#Pseudocolor">pseudocolour</a> images, often providing more contrast and allowing more details to be made out by the human eye. In fact, the study of human perception of colour is an extensive scietific field. But more on that later.</p>

<!-- more -->

<p>MATLAB has always had lots of colourful colourmaps, perhaps the most commonly used one being the default, <em>Jet</em>. A selection of the colourmaps are shown below.</p>

<p><img src="https://farm8.staticflickr.com/7576/16232226021_8c8296e382_o_d.png" alt="MATLAB colourmaps"></p>

<p>I&#39;ve also enjoyed creating my own colourmaps, to improve the visualization of data. In particular, I&#39;ve liked creating colourmaps which linearly traverse the full gamut of luminance, but that also vary in chrominance as much as possible, in order to maximize the contrast in colours. I was especially pleased when my <em>hicontrast</em> colourmap, which I used to colour depthmaps in a <a href="http://www.robots.ox.ac.uk/%7Eojw/2op/index.html">paper of mine</a>, was adopted by a <a href="http://www.cvlibs.net/datasets/kitti/eval_stereo_flow.php?benchmark=stereo">stereo benchmark</a>. Below are some of the colourmaps I&#39;ve created in the past.</p>

<p><img src="https://farm8.staticflickr.com/7505/16233272732_6c258823e7_o_d.png" alt="My colourmaps"></p>

<p>Coming back to the topic of human perception, a desirable property of a colourmap is that a given intensity difference looks about the same magnitude, regardless of where that difference occurs in the intensity spectrum, and for any value of intensity difference. Let&#39;s call this property <strong>perceptual homogeneity</strong>, because our perception of intensity differences should be the same (i.e. homogenous) over the whole spectrum.</p>

<p>In order to achieve perceptual homogeneity, a colourmap must have evenly spaced colours in a colourspace where Euclidean distance is equal to perceptual distance. Fortunately such colourspaces exist: CIE L*a*b colourspaces. Unfortunately, none of the colourmaps above actually achieve this. Creating such colourmaps has been something I&#39;ve wanted to for some time, but I never quite got round to it. However, The MathWorks recently released a new colourmap, <a href="http://blogs.mathworks.com/steve/2014/10/13/a-new-colormap-for-matlab-part-1-introduction/"><em>Parula</em></a>, which <em>is</em> perceptually homogenous, and it looks good.</p>

<p>This has spurred me on to create a few of my own, using optimization of the colourmap values in CIE 1976 L*a*b colourspace to achieve the perceptual homogeneity. As before, I&#39;ve also made them use the full range of luminance. You can see Parula, and my new colourmaps, below.</p>

<p><img src="https://farm8.staticflickr.com/7497/16048240007_2dfdd3736b_o_d.png" alt="New colourmaps"></p>

<p>I&#39;m not entirely happy with them; I&#39;d like them to be a bit brighter. However, achieving that, along with all the other constraints I had proved too much of a challenge. For now.</p>

<p>My six new, perceptually homogenous colourmaps, along with all my other colourmaps, including several more not shown here, are available for download as part of my <a href="http://www.mathworks.com/matlabcentral/fileexchange/16233">SC toolbox</a> for MATLAB, along with many other colourmaps and visualization tools. If you want to port them to another language and make them publicly available in that language also, feel free to do so, but please keep my copyright notice in the file(s) containing the colourmap values.</p>
]]></content>
  </entry>
  
  <entry>
    <title type="html"><![CDATA[Profiling performance]]></title>
    <link href="http://blog.distinctionl.com/blog/2014/10/31/profiling-performance/"/>
    <updated>2014-10-31T15:11:52+00:00</updated>
    <id>http://blog.distinctionl.com/blog/2014/10/31/profiling-performance</id>
    <content type="html"><![CDATA[<p>If you&#39;ve ever had to speed up some code you wrote, then hopefully you&#39;ll know about code profiling. If not then you really need to find out about it! What profiling does is tell you where your program spent most of its computation time. Knowing this allows you to focus your code optimization where it really matters - on the slow bits!</p>

<p>But what about how <em>well</em> your code, or rather your algorithm, performs? If you want to improve your algorithms performance, and it consists of a set of distinct tasks, it&#39;s worth knowing which of those tasks you should spend your time improving in order to get a gain in performance. No point wasting your time developing a much better object detector if it&#39;s your object classifier that sucks! But in order to know which tasks to improve, we need to perform some kind of profiling on algorithm performance, instead of computation time. How?</p>

<p>Well that&#39;s where another great tip from <a href="http://en.wikipedia.org/wiki/Andrew_Ng">Andrew Ng</a>&#39;s <a href="http://www.coursera.org/course/ml">Machine Learning course</a> can help you out: <strong>ceiling analysis</strong>. It&#39;s a way of profiling performance of algorithms. I&#39;ll let Andrew explain <a href="https://class.coursera.org/ml-003/lecture/113">how it works</a>.</p>
]]></content>
  </entry>
  
  <entry>
    <title type="html"><![CDATA[ML fitting of complex distributions]]></title>
    <link href="http://blog.distinctionl.com/blog/2014/10/30/ml-fitting-of-complex-distributions/"/>
    <updated>2014-10-30T15:52:23+00:00</updated>
    <id>http://blog.distinctionl.com/blog/2014/10/30/ml-fitting-of-complex-distributions</id>
    <content type="html"><![CDATA[<p>This post gives me the chance to show off something I&#39;ve just added support for: LaTeX equations using MathJax. Beautiful!</p>

<p>Let&#39;s imagine that I have some training data, $\{\x_1,..,\x_N\}$, and a non-negative function, $f(\x;\params)$, parameterized by $\params$, that I want to use as a probability distribution to fit to the data. The probability distribution is therefore given by</p>

<p>$$
p(\x;\params) = \frac{f(\x;\params)}{\int f(\vect{y};\params)\d\vect{y}}.
$$</p>

<p>A common thing to do is to maximize the likelihood (ML learning, not to be confused with machine learning) of the data, w.r.t. $\params$, i.e.</p>

<p>$$
\params^* = \argmax_\params \left(\int f(\vect{y};\params)\d\vect{y}\right)^{-N}\prod_{i=1}^N f(\x_i;\params).
$$</p>

<p>Whilst $f(\x;\params)$ is computable (since we defined it), the integral $\int f(\vect{y};\params) \d\vect{y}$ may not not be. For example, this is the case with complex models such as those defined by many deep networks. This creates a problem in ML fitting of the distribution.</p>

<!-- more -->

<p>There are several ways of overcoming this problem, which I&#39;m not going to list (though I invite people to name methods in the comments), but I will mention one: <strong>Contrastive Divergence</strong>, introduced by Geoffrey Hinton in 2002 in his paper <em><a href="http://www.mitpressjournals.org/doi/abs/10.1162/089976602760128018">&quot;Training products of experts by minimizing contrastive divergence&quot;</a></em>. It describes a way of computing a gradient of the training data likelihood w.r.t. model parameters, without computing the normalized likelihood itself, by perturbing the training data in the direction of the current model using <a href="http://en.wikipedia.org/wiki/Markov_chain_Monte_Carlo">MCMC</a> sampling.</p>

<p>I read and implemented this approach during my DPhil in 2005, but I thought the original paper on the subject was rather heavy going. So, because I&#39;m the kind of guy who likes to share knowledge, and to do so in an accessible way, I gave a couple of introductory seminars on the subject in Oxford.</p>

<p>Around the same time, January 2006, I also published some easy-to-follow <a href="https://sites.google.com/site/oliverwoodford/notes/NotesOnCD.pdf">notes on contrastive divergence</a> online. Since then, people seem to have found them useful. They&#39;ve been referenced in several other course notes, seminar slides and blogs. I&#39;ll even quote one: <em>&quot;For me, this paper is the best; precise, intuitive and make you hungry to know more!&quot;</em>, <a href="http://kittipatkampa.wordpress.com/2010/03/23/contrastive-divergence-for-parameter-estimation-in-dscrfs/">Kittipat Kampa</a>. So if you want to fit a non-integrable probability distribution to data, and are considering using contrastive divergence, give my notes a read.</p>
]]></content>
  </entry>
  
  <entry>
    <title type="html"><![CDATA[The future of technical computing]]></title>
    <link href="http://blog.distinctionl.com/blog/2014/10/15/the-future-of-technical-computing/"/>
    <updated>2014-10-15T13:02:54+01:00</updated>
    <id>http://blog.distinctionl.com/blog/2014/10/15/the-future-of-technical-computing</id>
    <content type="html"><![CDATA[<p>I&#39;ve been thinking a bit in recent months about whether I should move to using a new programming langauge. Traditionally I&#39;ve done prototyping of algorithms in <a href="http://www.mathworks.com/products/matlab/">MATLAB</a>, and the development of real-time or production code in <a href="http://en.wikipedia.org/wiki/C%2B%2B">C++</a>, using <a href="http://www.visualstudio.com/">Visual Studio</a>. However, for various reasons, which I&#39;ll discuss, I&#39;ve considered moving to <a href="http://julialang.org/">Julia</a>. Here are my current thoughts on the subject. </p>

<!-- more -->

<h3>MATLAB</h3>

<p>I like MATLAB for several reasons:</p>

<ol>
<li>The high-level syntax makes programming complex algorithms quite simple, using relatively few lines of code.</li>
<li>It&#39;s interpreted, so there is no compilation step before running. You just type and execute. This makes the development cycle very fast.</li>
<li>Debugging is very easy. Firstly, when errors occur, MATLAB prints out useful comments about where the error occurred and what caused the error. Secondly, the MATLAB IDE allows you pause to execution on any line, as well as when an error occurs, then inspect the variables as well as run commands on the command line.</li>
<li>There&#39;s a very good profiler, so you can write your code straightfowardly first, then optimize it later using the profiler to work out which areas to speed up.</li>
<li>The graphics API is very high-level, so it&#39;s easy to render some useful plots in 2D or 3D in just a few lines of code.</li>
<li>There&#39;s great documentation and a good online community to answer questions and provide lots of user-written functions.</li>
<li>It&#39;s cross platform. You can run the same code on Windows, Linux or Mac, as long as you have MATLAB installed.</li>
</ol>

<p>So why would I need anything else? Well, for one thing, MATLAB execution times can be quite slow. Even after I&#39;ve fully optimized some code (and I consider myself an expert at that), some algorithms can be sped up by as much as 10x with a C++ implementation. Secondly, the graphics can be quite slow, and are also limited by the API. Lastly, it&#39;s expensive; most languages are free and open, but MATLAB is a proprietary language and IDE, and licenses cost a lot, especially when all the required toolboxes have been added. Now that I&#39;m freelance I&#39;ve had to ask myself whether I want to fork out for the MATLAB license in order to keep working in it, or whether now might be the time to switch to a new language.</p>

<h3>Other options</h3>

<p>There is a large and ever growing number of programming languages to choose from. As I said, I&#39;ve tended to use C++ alongside MATLAB. It&#39;s slower to develop and debug in, but being <em>closer to the metal</em> (i.e. what you write resembles more closely what the CPU actually does), it&#39;s possible to write faster programs, as well as have better control over concurrency. When I need to really parallelize something I write <a href="https://developer.nvidia.com/cuda-zone">CUDA</a> code for Nvidia GPUs. But I wouldn&#39;t choose this to prototype in, because the development time is too slow.</p>

<p>So what other high-level, interpreted languages like MATLAB are available, which overcome the cost and speed issues, whilst not sacrificing too much on the other points. &quot;<a href="http://www.python.org/">Python</a>&quot;, I hear many of you say. Well, it&#39;s certainly free, but it isn&#39;t fast, plus the debugging and profiling tools aren&#39;t nearly as good. Personally, I&#39;d rather pay for MATLAB right now.</p>

<h3>Julia</h3>

<p>How about the new kid on the block in technical computing, Julia? Using an LLVM compiler, it claims speeds similar to C, which is fantastic; it would forgo the need to reimplement anything for production code. It has built in support for concurrency for large scale computing, and, with a small but dedicated user community, new functionality is being developed all the time. It is a very exciting proposition.</p>

<p>Having said that, as things stand, from my experience, the debugging capabilites aren&#39;t quite there yet, which makes development a little slow at the moment. Also, because it&#39;s a langauge and not an IDE, the graphics aren&#39;t built in. There are several graphics packages, but they mostly do 2D plots only, and there is no unified interface. But, like I say, there&#39;s a strong community working on these things, so I expect good things in the future.</p>

<p>However, I&#39;ve also just attended a European MATLAB Advisory Board meeting, where I got a sneak preview of the future of MATLAB. I can&#39;t share what I saw, but there were some reasons to believe that MATLAB will continue to become an even better product. As for the price, MATLAB is now available with a variety of non-commercial licenses, and I&#39;ve been told that startups who can&#39;t afford the commercial licenses should contact sales, so perhaps their previous inflexibility on pricing is on the wane.</p>

<p>One thing is for sure. The future of technical computing is exciting. As for me, I haven&#39;t yet decided what I&#39;ll use.</p>
]]></content>
  </entry>
  
  <entry>
    <title type="html"><![CDATA[The perils of overfitting]]></title>
    <link href="http://blog.distinctionl.com/blog/2014/09/27/the-perils-of-overfitting/"/>
    <updated>2014-09-27T10:59:37+01:00</updated>
    <id>http://blog.distinctionl.com/blog/2014/09/27/the-perils-of-overfitting</id>
    <content type="html"><![CDATA[<p>Given my last blog post on using learning curves to diagnose over or under-fitting, it&#39;s a fitting ;) time to share this video. In it some talented folks from Brown University and Georgia Tech lay bare the perils of both over and under-fitting, in a rather original way. So without further ado, take it away guys&#8230; 
<iframe width="640" height="360" src="//www.youtube.com/embed/fJMXDlNkYvU?rel=0" frameborder="0" allowfullscreen></iframe></p>
]]></content>
  </entry>
  
  <entry>
    <title type="html"><![CDATA[Analysing learning curves]]></title>
    <link href="http://blog.distinctionl.com/blog/2014/09/22/analysing-learning-curves/"/>
    <updated>2014-09-22T17:02:38+01:00</updated>
    <id>http://blog.distinctionl.com/blog/2014/09/22/analysing-learning-curves</id>
    <content type="html"><![CDATA[<p>I recently looked over Machine Learning high-flier <a href="http://en.wikipedia.org/wiki/Andrew_Ng">Andrew Ng</a>&#39;s <a href="http://www.coursera.org/course/ml">Machine Learning course</a> on <a href="http://www.coursera.org/">Coursera</a>. It&#39;s perfect for people who want to use machine learning as a tool, and is also a great primer for people who want to get into machine learning research, though it is far more vocational than theoretical.</p>

<p>Of course, being practical, it has all sorts of useful tips to help you get your methods working well. One such tip is some basic plotting and analysis of the <em>learning curves</em> of your current implementation, which can point you towards what to try next if things aren&#39;t quite working yet. This analysis can save you a lot of time! I recommend the course, but if you just want to know how to do this analysis then look no further than this blog post.</p>

<!-- more -->

<h2>Data, model and learning</h2>

<p>For any machine learning problem, you should have some training data, and a model you want to learn, or fit to the data. For example, in this post I&#39;ll be using a dataset of <a href="http://people.sc.fsu.edu/%7Ejburkardt/datasets/regression/x17.txt">fuel octane rating versus raw materials</a>, and the model I&#39;ll be fitting to this data is a linear function which takes as input the raw material composition, and outputs the real-valued octane rating - this is known as linear regression.</p>

<p>The model defines a cost function to minimize. This generally consists of a term which indicates how well the model agrees with the data, called the <em>data cost</em>, and possibly one or more other terms, which can regularize the space of solutions. Learning is then the process of minimizing the cost function over the training set, with respect to the model parameters. All very standard thus far. In addition, you need to split your data up into two sets, one for learning the model parameters (the &quot;training&quot; set), and one for evaluating them (the &quot;test&quot; set). That&#39;s fairly common too.</p>

<h2>Learning curves</h2>

<p>Learning curves are created as follows:</p>

<ol>
<li>Learn the model parameters for several different sizes of training data sets, upto the largest size possible (whilst leaving enough data aside for the test set).</li>
<li>For each set of learned parameters, compute the average data cost (note that this does not include any regularization costs) per input datum used to learn the parameters, and per test set datum.</li>
<li>Plot the average data costs for both the training set and the test set, plotted against the training set size.</li>
</ol>

<p>I have done this below, using the example dataset I mentioned earlier, for two cases, the first using just one material composition value (or data feature), and the second using all four values (or features) given in the dataset.</p>

<p><img src="http://blog.distinctionl.com/images/learning_curve_1.png" alt="">
<img src="http://blog.distinctionl.com/images/learning_curve_2.png" alt=""></p>

<p>
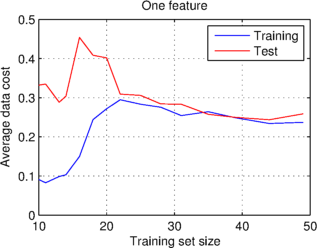
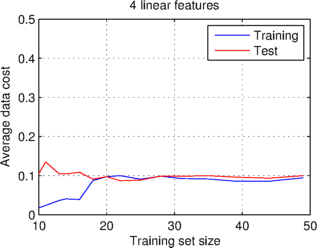
What the graphs show is that at a certain training set size, the average data costs converge on a stable value, which is the same for the training and test sets. They also show that the learning curves for the case of just one feature have a significantly higher data cost than the other case.</p>

<h2>Bias and variance</h2>

<p>Bias is the name given to a constant error, in the case of learning curves an error which affects both the training and test sets. The first graph above exhibits high bias, because both curves settle on a large average data cost, relative to what we might expect or desire. High bias is caused by the model underfitting the data; the particular bias above caused by the model not having enough features to fit to. By contrast, the second graph, where the model has more features to use, has a lower bias, within the realms of what one might wish for.</p>

<p>
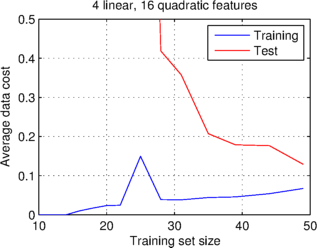
Variance is the name given to a variable error, in the case of learning curves an error which affects the test set but not the training set. Below I have plotted two further pairs of learning curves. In the case of the first graph I have used even more features, by including all quadratic combinations of features, giving twenty features in total. What you can see is that the data costs do not quite stabilize as the training set size increases, though they look like they could converge with more data. In addition, the data cost of the test set is significantly higher than that of the training set, so this graph exhibits high variance. </p>

<p><img src="http://blog.distinctionl.com/images/learning_curve_3.png" alt="">
<img src="http://blog.distinctionl.com/images/learning_curve_4.png" alt=""></p>

<p>
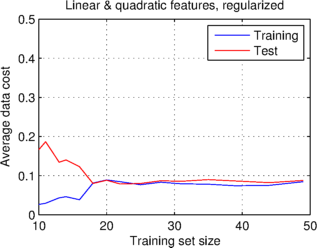
High variance is caused by the model overfitting the training data, and therefore not transferring well to the test data. Overfitting can be caused by having many unnecessary features (as is likely in the case above), or not enough training data. One way of reducing overfitting is to use a regularization term in the cost function, which prefers simpler models. I have used a quadratic cost on the model parameters to regularize the model, whose learning curves are shown in the second graph above. This graph exhibits low variance, indicating that the model is now not overfit.</p>

<h2>What steps to take</h2>

<p>When you look at your learning curves, you should see one of three scenarios:</p>

<ol>
<li>The test set data cost is higher than the training set data cost (high variance), indicating that the model is overfitting the data. Possible steps to try in this case are:

<ol>
<li>Using more training data.</li>
<li>Using fewer data features.</li>
<li>Using a regularization term which prefers simpler models.</li>
</ol></li>
<li>The data costs are similar, but higher than desirable (high bias), indicating that the model is underfitting the data. Possible steps to try in this case are:

<ol>
<li>Using more data features, either by taking more measurements or by creating features by multiplying together those already given.</li>
<li>Using a more complex model, e.g. by changing from linear regression to a neural net.</li>
</ol></li>
<li>The data costs are similar, and sufficiently low, indicating low variance and low bias. In this case you&#39;re all done!</li>
</ol>

<p>I hope that is useful. Code for generating these figures can be found in <em>bias<em>variance</em>analysis_demo.m</em> from our <a href="http://github.com/distinctionl/ml_examples">ml_examples GitHub repository</a>.</p>
]]></content>
  </entry>
  
  <entry>
    <title type="html"><![CDATA[Get lost in the cloud]]></title>
    <link href="http://blog.distinctionl.com/blog/2014/09/08/get-lost-in-the-cloud/"/>
    <updated>2014-09-08T14:05:42+01:00</updated>
    <id>http://blog.distinctionl.com/blog/2014/09/08/get-lost-in-the-cloud</id>
    <content type="html"><![CDATA[<p>Hopefully you find <a href="http://www.ted.com">TED talks</a> as inspiring and thought provoking as I do. Anyway, I came across a real gem for all researchers the other day. Now this is nothing to do with cloud storage or cloud computing. It posits the idea that in order to have a great new idea, you have to get lost and confused. Mindblowingly simple, yet insightful. Enjoy&#8230;
<iframe src="https://embed-ssl.ted.com/talks/uri_alon_why_truly_innovative_science_demands_a_leap_into_the_unknown.html" width="640" height="360" frameborder="0" scrolling="no" webkitAllowFullScreen mozallowfullscreen allowFullScreen></iframe></p>

<p>Now get lost.</p>
]]></content>
  </entry>
  
  <entry>
    <title type="html"><![CDATA[DeepMind patents: I]]></title>
    <link href="http://blog.distinctionl.com/blog/2014/09/02/deepmind-patents-i/"/>
    <updated>2014-09-02T14:12:01+01:00</updated>
    <id>http://blog.distinctionl.com/blog/2014/09/02/deepmind-patents-i</id>
    <content type="html"><![CDATA[<p>I&#39;m sure many of you will have heard about <a href="http://www.bbc.co.uk/news/technology-25908379">Google&#39;s £400m purchase</a> of <a href="http://deepmind.com">DeepMind</a>, a startup founded to solve Artificial Intelligence (AI). They focussed on developing algorithms that would allow machines to learn how to play computer games. It&#39;s this generality which makes their approach AI rather than Machine Learning (ML). And apparently the computer gets pretty good, eventually beating human players.</p>

<p>What intrigues me is how this technology works. Of course much of it is a closely guarded secret, but prior to being bought, DeepMind did file three patents, so I thought it would be interesting to read these. In this blog post, I&#39;ll be taking a look at the first of them, <a href="http://www.google.com/patents/US20140185959">US20140185959</a>.</p>

<!-- more -->

<p>To save some of you some time, it&#39;s probably worth saying up front that this particular patent doesn&#39;t contain any AI or ML technology. Instead, it presents two ideas, to be used in conjunction, for the purpose of searching for images using example images, a.k.a. <em>content-based image retrieval</em>.</p>

<p>The first idea is what I&#39;ll call the <em>composite feature query</em>. Basically, it&#39;s an image query that consists of user-selected image features from one or more images. For example, if you wanted to find a particular sofa you could use the shape and colour features of a sofa in one image with the texture of some curtains in another image as your query.</p>

<p>The second idea is what I&#39;ll call <em>iterated query refinement</em>. You start with one or more features from one image, do a search, then use one or more extra features from the original image or the search results to augment the query, and repeat the search. This process can be repeated until you find an image you&#39;re happy with.</p>

<p>That&#39;s it! It&#39;s not related to learning to play computer games. But then, that could be just the toy problem that DeepMind use to develop their algorithms, and perhaps making online shopping easier is the real target application (or at least one of them). Nor does it explain how image features might be described and matched within the search process - the tricky ML part. Perhaps the answer to that will crop up in other patents. But I am reminded of something my friend Tom at <a href="http://metail.com/">Metail</a> once told me, which was that if you&#39;re a business that&#39;s looking to get bought, then you need an IP portfolio that&#39;s broad, covering all areas of your business, not just the core technology.</p>
]]></content>
  </entry>
  
</feed>
